
Six Metrics That Tell You Whether Gold Is Worth Buying Right Now


Stocks have the P/E ratio. Bonds have the coupon and the yield curve. Gold has neither. It pays no dividend, generates no cash flow, and has no earnings to compare its price against. That makes it tempting to fall back on gut feeling: gold is at a record high, so it must be expensive, or gold has been rallying, so the trend must continue.
Neither instinct is reliable. Gold has its own set of checkable indicators, and once you know what they are, you can build a genuinely useful read on whether the conditions around gold are supportive or not. Here are the ones that matter most, what they’re doing right now, and where to check them yourself.
1. US real interest rates: the single most important number
Gold earns nothing while you hold it. The real question for any gold buyer is: what am I giving up by holding gold instead of something that pays interest? That opportunity cost is best measured by the yield on 10-year Treasury Inflation-Protected Securities (TIPS), commonly called the real yield.
When real yields fall, the cost of holding non-yielding gold shrinks, and gold tends to become more attractive. When real yields rise, safe assets start paying you more to sit still, and gold tends to lose ground.
Check it free on FRED, series DFII10. Don’t fixate on the exact number. Watch the direction over the past one to three months.
2. The US dollar
Gold is priced in US dollars globally, so a weaker dollar mechanically makes gold cheaper for anyone holding other currencies, which tends to lift demand. A stronger dollar works the other way.
The US Dollar Index (DXY) on TradingView tracks the dollar against a basket of six major currencies and is free to check. The useful read isn’t the absolute level, it’s the relationship between DXY and the gold price:
- Gold rising while DXY falls is the healthiest combination for a gold bull market.
- Gold rising while DXY also rises is unusual and worth paying attention to, because it suggests something else, often fear or crisis demand, is doing the heavy lifting.
- Gold falling while DXY rises is the textbook bearish setup.
3. What the Fed is expected to do next
Interest rate expectations move real yields and the dollar before the actual rate decision even happens. The CME FedWatch tool, free to use, shows the probability the market is currently pricing in for the Fed’s next move based on Fed funds futures.
Here’s why this matters as a real-time example. As of mid-August 2026, markets are pricing in roughly even odds of a Fed rate hike at the September meeting rather than a cut, largely because oil prices tied to the ongoing US-Iran tensions around the Strait of Hormuz have pushed inflation expectations back up. That’s normally a bearish setup for gold. Yet gold has continued climbing toward $4,450 an ounce over the same period. That divergence is a useful reminder that rate expectations are one input among several, not the whole story. When gold rises despite a hawkish Fed and a firm dollar, it usually means geopolitical risk or central bank demand is overriding the usual playbook, which is exactly what appears to be happening right now.
4. Gold ETF flows
Exchange-traded funds backed by physical gold are a direct window into institutional and retail investment demand. When money is flowing into gold ETFs, it means investors are actively adding gold to portfolios. When it’s flowing out, they’re reducing exposure.
The World Gold Council’s Goldhub publishes this data monthly, free to access. It’s most useful when you look at the trend rather than a single month. As of the most recent reading, global gold ETFs took in about $3 billion in July 2026, reversing two straight months of outflows in May and June that were driven largely by North American investors reacting to a stronger dollar and rising real yields. A single month of inflows after a rough patch is worth watching rather than acting on. Three or four months of accelerating inflows is a much stronger signal.
5. Central bank buying
This has become one of the more structurally important gold indicators over the past few years, because central banks, particularly in Asia, have shifted from occasional buyers to consistent, large-scale accumulators. China’s central bank, for example, added roughly 20 tonnes to its reserves in July 2026 after buying about 15 tonnes in June, its largest monthly increase since October 2023.
This kind of buying tends to put a floor under gold demand that isn’t sensitive to short-term interest rate moves, which is part of why gold has been able to hold up even when the dollar and rate outlook aren’t cooperating. Goldhub also tracks this. Check it quarterly rather than monthly, since individual months can be noisy or later revised.
6. Futures positioning (the crowding check)
The CFTC’s weekly Commitment of Traders report shows how heavily speculative traders, mostly hedge funds and other large investors, are positioned in gold futures. This one works a little differently from the others: it’s not simply bullish-good, bearish-bad.
If speculative positioning is already extremely long, a lot of the buying may have already happened, which can leave gold vulnerable to a pullback even if the fundamentals still look supportive. If positioning is unusually light despite a favourable backdrop, that can actually be a bullish setup, since there’s more room for new buying to come in. If reading the raw CFTC tables feels like a lot, sites like Tradingster republish the same data in an easier chart format. It’s worth knowing this data reflects positioning as of the prior Tuesday, so it’s always a few days behind the current price action.
Two relative-value ratios worth knowing (but not trading on)
These won’t tell you whether gold will rise or fall next month, but they give useful context on how expensive gold looks relative to other assets.
Gold/Silver ratio. Divide the gold price by the silver price. With gold near $4,400 and silver in the mid-$50s, the ratio currently sits in the high 70s to low 80s. Track it on Macrotrends. A historically high ratio can suggest gold is expensive relative to silver, or that silver has room to catch up.
Gold/S&P 500 ratio. This tracks investor preference for hard assets versus financial assets more broadly. Extreme readings in either direction have historically lined up with major shifts in sentiment between the two, though “extreme” is only obvious in hindsight.
How to actually score it
Here’s a concrete way to turn the first six metrics into a single number, so you’re not just eyeballing it.
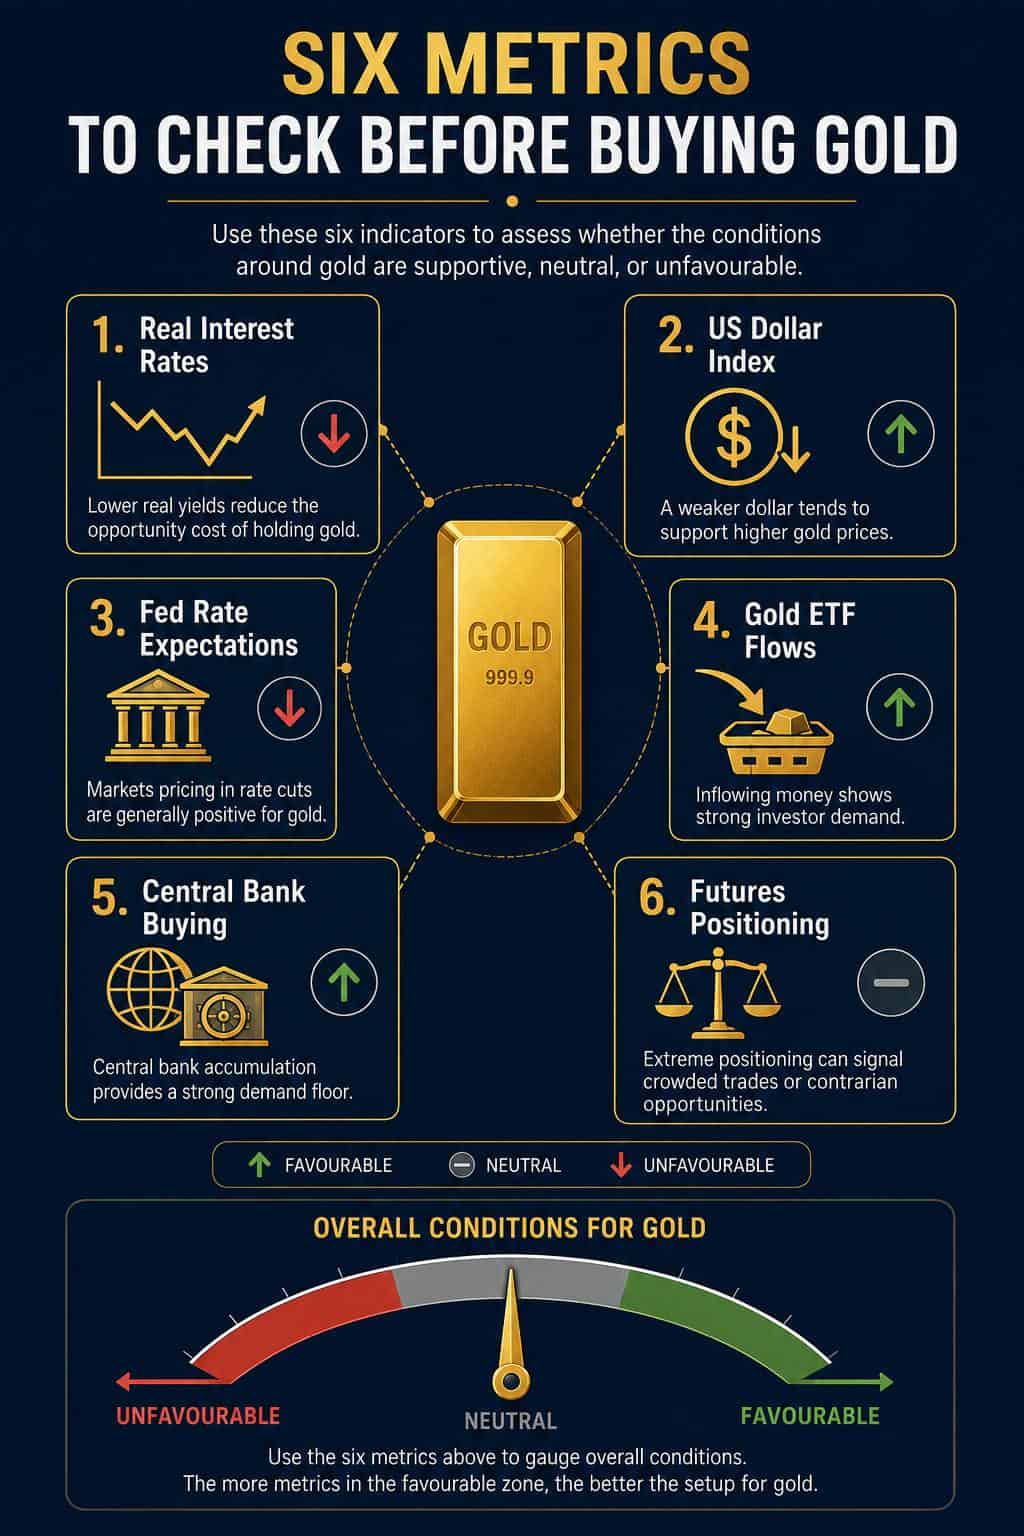
Source: Mooloo graphics
For each metric, look at the change over roughly the last month and score it +1, 0, or -1 using these rules:
| Metric | Score +1 | Score 0 | Score -1 |
|---|---|---|---|
| Real yields (DFII10) | Fallen 0.1 points or more | Roughly flat | Risen 0.1 points or more |
| US dollar (DXY) | Fallen 1% or more | Roughly flat | Risen 1% or more |
| Fed rate expectations (FedWatch) | Odds of a cut have increased | Little change | Odds of a hike have increased |
| ETF flows (Goldhub) | Inflows, and larger than the prior month | Flows near zero | Outflows, or shrinking inflows |
| Central bank buying (Goldhub) | Net purchases rising month over month | Roughly steady | Net purchases slowing or net selling |
| Futures positioning (CFTC COT) | Speculative net-long is below its 12-month average | Near the 12-month average | Speculative net-long is well above its 12-month average (crowded) |
Add the six scores together. That gives you a number from -6 to +6:
- +4 to +6: conditions are broadly stacked in gold’s favour
- +1 to +3: mildly supportive, but not a strong signal on its own
- 0: genuinely mixed, the drivers are pulling in different directions
- -1 to -3: mildly unfavourable
- -4 to -6: conditions are broadly working against gold
Worked example, using where things stand in mid-August 2026: real yields have been roughly flat to slightly higher (0), the dollar has been firm rather than falling (-1), Fed odds have shifted toward a hike rather than a cut (-1), ETF flows turned positive in July after two down months (+1), central bank buying accelerated in July versus June (+1), and speculative positioning isn’t obviously stretched (0). That totals 0, a genuinely mixed reading, and it matches what’s actually happening: gold is grinding higher despite two of the usual headwinds, because central bank demand and geopolitical risk are picking up the slack. A mixed score doesn’t mean “do nothing.” It means the case isn’t clean either way, so position size and conviction should reflect that rather than treating gold as an obvious buy or an obvious avoid.
Run this once a week and you’ll start to see the score drift before the price obviously reflects it, which is generally more useful than reacting to a headline about a new record high.
This isn’t a timing tool for calling next week’s price. It’s a way of checking whether the structural backdrop supports holding or adding to gold, which is a more honest question than trying to guess a short-term top or bottom. It also doesn’t replace thinking about why you’d want gold in the first place, whether that’s a portfolio hedge, inflation protection, or a bet on continued central bank demand. But running the numbers before buying, rather than reacting to a headline, is the difference between an informed decision and a guess.