What Do Retirees Actually Spend Money On? The Surprising Reality from Age 60 to Death

Retirement isn’t a single chapter, it unfolds in three phases: the Go-Go (60–75), Slow-Go (75–85), and No-Go (85+) years. Spending peaks early as retirees travel, renovate, and enjoy active lifestyles, then gradually declines as health and mobility change. Understanding these spending curves can help you plan smarter, not just how much to save, but when and how you’ll actually spend it.
- Spending peaks early: Households aged 65–74 spend the most of any retirement group, led by travel, dining, and home projects.
- Mid-retirement costs drop: By age 75, total expenses typically fall 20–40%, driven by less travel, reduced driving, and smaller appetites – not financial strain.
- Healthcare rises late: Out-of-pocket medical costs double from ages 65–84 to 85+, per CMS; plan for this back-loaded expense.
- Home help replaces DIY: Lawn care, cleaning, and handyman services grow in importance as mobility declines (National Institute on Aging).
- Adapt, don’t assume: Traditional “replace 80% of income” rules miss reality, your spending naturally tapers, but needs shift toward care and support.
You’ve saved diligently for retirement. You’ve run the calculators. You know your numbers. But here’s the uncomfortable truth: you probably have no idea what you’ll actually spend that money on.
Most retirement planning focuses on how much you need, not what you’ll buy with it. Will you travel the world or stay close to home? Dine out or cook in? Keep driving or hang up the keys? These aren’t just lifestyle questions, they’re financial planning questions. And data from retirees across the United States, United Kingdom, Canada, and Australia reveal patterns that might surprise you.
The Three Phases of Retirement Spending
Forget the idea that retirement is one long, uniform phase. Research shows that retirement spending typically follows three distinct stages, each with its own pattern of behavior and priorities. Economists often refer to them as the Go-Go, Slow-Go, and No-Go Years.
The Go-Go Years (Ages 60–75): When You Spend the Most
This is when retirees are healthiest, most active, and often spending the most. According to the U.S. Bureau of Labor Statistics, households aged 65–74 have the highest average annual expenditures of any retirement-age group. Travel, dining, leisure, and home projects dominate budgets during these years.
What you’re actually buying:
Travel and leisure take center stage. Many retirees who postponed big trips finally take them, European tours, cruises, or visits to family abroad. The travel industry consistently identifies the 60-to-70 age group as one of its most active and profitable demographics.
Restaurant spending also remains high. Without work schedules, retirees dine out more often, sometimes for convenience, sometimes for enjoyment. While “early-bird specials” are common, this phase also sees more spending at mid-and high-end restaurants than during working years.
Home improvement activity becomes a priority. With more time and often a paid-off mortgage, retirees invest in renovations such as kitchen upgrades, bathroom remodels, or landscaping. Data from the National Association of Home Builders shows remodeling demand is strongest among homeowners in their 60s.
Entertainment and hobbies also expand. Kiplinger notes that early retirees often spend more on golf, fitness memberships, streaming services, and theater subscriptions, the activities they once postponed for lack of time. The Go-Go years are when retirees finally enjoy the freedom they’ve planned for.
The Slow-Go Years (Ages 75-85): The Gradual Decline
Something shifts around age 75. It’s subtle at first, but the evidence is clear across multiple studies and countries: total spending begins to decline, not because retirees suddenly become frugal, but because their lifestyles naturally contract as mobility and energy decrease.
What changes:
Travel slows down: International trips become less frequent, then eventually stop altogether for most households. The ten-hour flight that once felt exciting now feels exhausting. Domestic travel replaces global adventures, and even road trips become rarer over time.
Transportation costs fall sharply: According to the U.S. Bureau of Labor Statistics, average household transportation spending drops from roughly $9,500 for those aged 55–64 to about $5,100 for those 75 and older. Many retirees drive less, downsize to one vehicle, or give up driving altogether. While auto-insurance premiums can rise slightly with age, overall transportation expenses decline because of reduced usage.
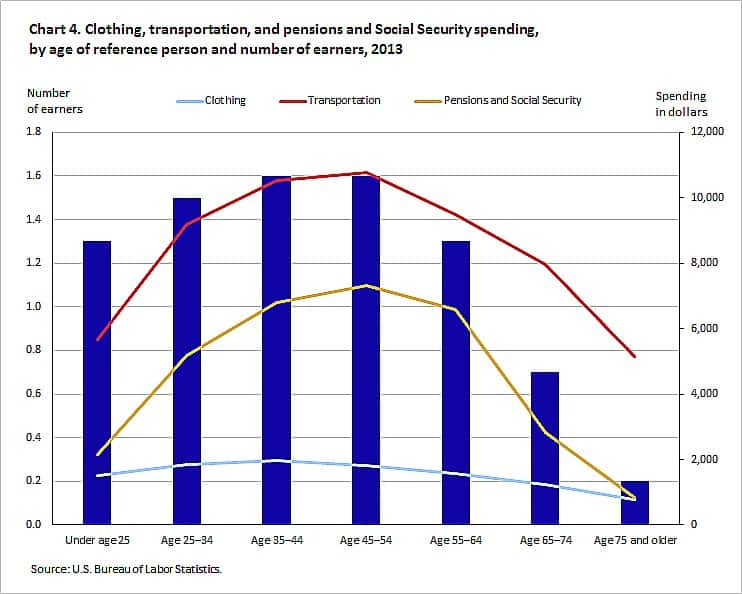
Source: US Bureau Of Labor Statistics
Food spending shifts – and shrinks: Dining out becomes less frequent, while grocery spending takes a larger share of the food budget. Yet total food expenditures still decline steadily with age. The average food spending falls from nearly $7,900 in midlife to about $4,100 for those 75 and older. Smaller appetites, simplified meals, and smaller household sizes all contribute to this trend.
Clothing purchases plummet: Workwear is long gone, and special occasions become fewer. Clothing and apparel spending drops from about $1,789 for the 55–64 age group to just $683 for retirees over 75.
Entertainment becomes home-based: Concerts, theaters, and sporting events give way to television and streaming subscriptions. Hobbies that once required gear or travel often fade. Average entertainment spending falls from about $2,988 for 65–74-year-olds to roughly $1,626 for those 75 and older.
But two categories move in the opposite direction:
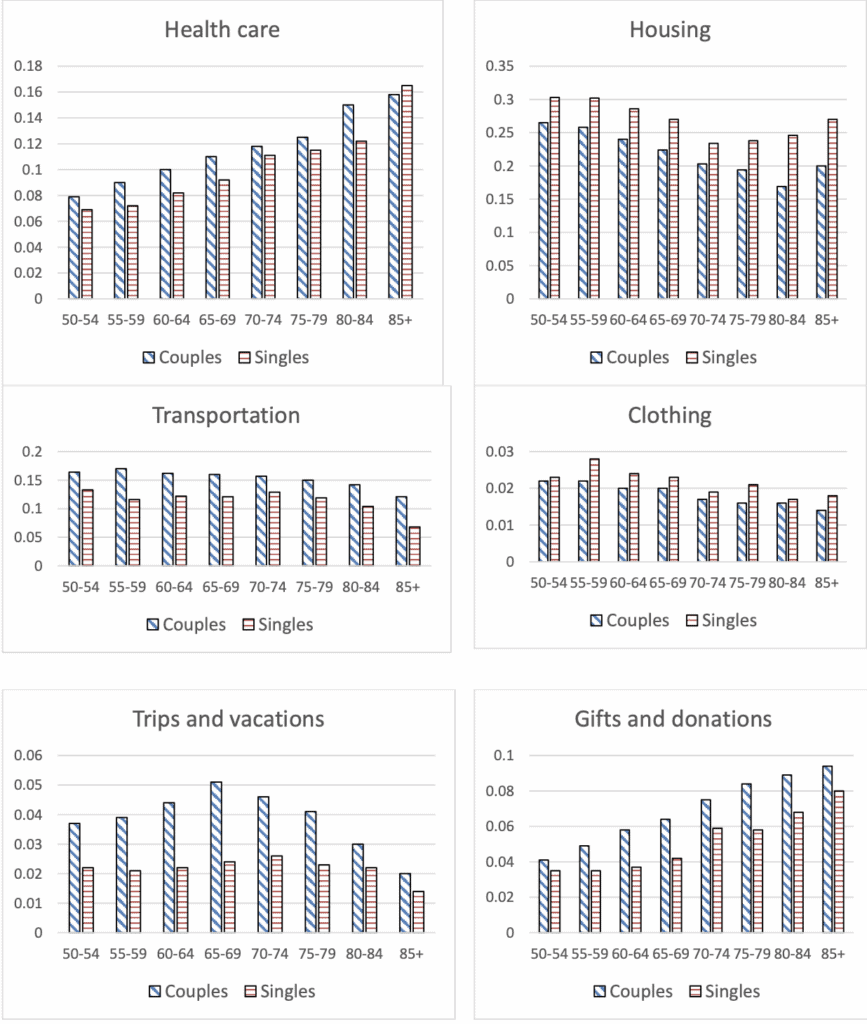
Healthcare costs rise steadily: Out-of-pocket expenses for prescription drugs, medical equipment, and specialist visits increase with age. The share of household budgets devoted to healthcare climbs from 8.8% for ages 55–64 to 15.6% for ages 75 and older. Medications account for a growing portion of this increase.
Household services grow in importance: This is the quiet category many retirees underestimate. Lawn care, home cleaning, handyman work, and meal-delivery services gradually replace do-it-yourself chores as physical capability declines. While total household spending falls, spending on these support services often rises within the home-maintenance category.
The No-Go Years (Age 85+): A Different Kind of Spending
The Patterns That Hold True Everywhere
Across the United States, United Kingdom, Canada, and Australia, retirement spending patterns are strikingly similar despite cultural and healthcare differences. Housing remains the largest expense at every stage of retirement but declines steadily as most retirees pay off their mortgages by their late 60s. In the U.S., for instance, average annual housing costs fall from around $18,000 for those aged 55–64 to about $13,375 for those 75 and older, a trend echoed in international studies like the Urban Institute’s analysis of retirement spending.
The overall decline in expenses is well-documented. Total household spending typically drops by 20–40% from peak earning years to late retirement, not merely due to reduced income but because retirees’ lifestyles and activities naturally slow down with age. Even affluent retirees who could maintain higher spending often choose not to, as detailed in the Financial Planning Association’s report on the retirement consumption puzzle.
Spending patterns also vary by income level. Wealthier households may sustain or slightly increase spending through their late 60s and mid-70s before it gradually declines, while lower-income retirees experience a steady reduction throughout. Despite this, the “retirement satisfaction puzzle” remains, retirees across income levels report high satisfaction even as they spend less. Many find their expenses meet or exceed expectations, and a large portion continue to save rather than deplete their wealth, as shown in Corebridge Financial’s retirement spending insights.
What the Numbers Mean for Your Planning
Understanding these patterns changes how you should think about retirement savings. Don’t plan for constant spending. The common rule of replacing 70–80% of pre-retirement income assumes steady expenses, but data from the U.S. Bureau of Labor Statistics shows spending typically peaks in the early 60s and falls by 20–40% by the late 70s.
Front-load the experiences. Travel is best done in your 60s and early 70s. Studies show international travel declines sharply after 75 and nearly stops by 80 for most retirees. Budget for home services earlier. Research finds that by the mid-70s, many adults need help with home maintenance and daily tasks, which often become essential by 80.
Healthcare costs are back-loaded. Healthcare expenses rise gradually but surge after 80 due to long-term care needs. The second car has a shelf life. BLS data shows transportation spending drops by half from the 60s to the 80s as retirees drive less and shift to one or no car.
Your hobby spending window is shorter than you think. Participation in physical hobbies like golf or skiing falls sharply after 75, making early retirement the best time to enjoy them.
The Categories Most People Underestimate
When planning retirement budgets, people consistently get these wrong:
They overestimate: Housing costs (assuming they’ll stay constant), transportation expenses (not accounting for reduced driving), food costs (appetites and restaurant visits decrease), entertainment spending (mobility limitations change everything).
They underestimate: Home services and help (cleaning, lawn care, handyman), healthcare out-of-pocket costs (even with Medicare or national health systems), technology support (devices, subscriptions, help using them), home modifications for aging in place.
What This Means Right Now
If you’re in your 50s planning for retirement, base your budget on real spending patterns. Research from the RAND Corporation shows that expenses usually peak in the early 60s to early 70s, then steadily decline. This isn’t due to financial strain but to lifestyle changes as activity levels decrease.
If you’re 60–75, this is your active “Go-Go” phase, the ideal time for travel, dining out, and hobbies. Studies confirm that discretionary spending drops after 75 as mobility and health naturally slow down.
For those 75 and older, lower spending is normal and not a sign of decline. Research from the Michigan Retirement Research Center shows retirees often spend less simply because they want or need less, not because they can’t afford more.
The Bottom Line
Retirement isn’t just about how much you’ve saved, it’s about when and how you’ll spend it. The data is clear: spending peaks in your 60s and early 70s, then declines as energy, mobility, and lifestyle shift. Plan for an active first decade of retirement, prepare for rising healthcare and home-service costs later, and don’t feel guilty when your spending naturally tapers off. A realistic retirement plan doesn’t aim for constant spending, it adapts to the rhythm of life itself.
This article is part of Mooloo’s Retirement & Long-Term Planning Hub, covering retirement income, Social Security decisions, investment risk, healthcare costs, and long-term financial security.