When Does a Market Decline Become a Crash? What Investors Need to Know

Market downturns are inevitable, but not every drop is a disaster. A market correction typically means a 10–20% decline that occurs roughly every two years, while a bear market extends losses past 20% over a longer period. A market crash, by contrast, is defined by both speed and emotion, sharp selloffs, panic, and liquidity stress, as seen in Black Monday (1987) or the COVID-19 crash (2020). Recognizing the difference helps investors stay rational and avoid costly timing mistakes.
- Speed matters more than size: A drop of 10–15% in days can indicate crash conditions, while slower declines suggest corrections or bear markets.
- Watch key signals: When 80–90% of stocks fall together, the VIX index surges above 50, or credit spreads widen sharply, panic may be spreading.
- Stay invested and diversified: Missing just the best 10 recovery days can cut long-term returns by half.
- Focus on preparation, not prediction: Build portfolios aligned with risk tolerance, maintain an emergency fund, and rebalance strategically during downturns.
- History’s bottom line: Despite repeated crashes since 1929, the S&P 500’s long-term return remains around 9–10% annually, rewarding patience over panic.
Market downturns are an unavoidable reality of investing. Whether you’re trading stocks, ETFs, or crypto, prices don’t move in a straight line forever. Every bull market eventually faces pullbacks, but not every decline signals disaster. Understanding the difference between a normal market correction and a full-blown crash is essential for protecting your portfolio, managing risk, and avoiding emotionally driven mistakes.
The Terminology Problem
Here’s something that might surprise you: there’s no official definition of a market crash. Unlike other market movements, which have clear thresholds, a crash remains a qualitative term driven by speed, psychology, and panic selling.
What we do have consensus on:
A market correction occurs when prices fall about 10–20% from recent highs, often as part of normal market cycles. Historically, the S&P 500 experiences a correction roughly once every two years.
A bear market is a deeper decline of 20% or more, usually happening every four to five years as part of long-term market behavior.
A market crash, however, is defined not only by the scale of the decline but also by its speed and emotional intensity. Crashes trigger sudden selloffs, fear-driven reactions, and liquidity shocks—making them as much psychological events as financial ones.
What Makes a Crash Different
Looking at historical market crashes reveals a clear pattern, they combine severity with shocking speed.
Black Monday in October 1987 saw the Dow Jones Industrial Average plunge 22.6% in a single trading day, the largest one-day decline in U.S. stock market history. The 2020 COVID-19 crash sent the S&P 500 down about 34% in just over a month, marking one of the fastest collapses ever recorded.
By contrast, the 2000–2002 dot-com bear market saw the NASDAQ fall more than 75%, but it took nearly two and a half years to reach its bottom. While devastating, its slower pace is why it’s categorized as a bear market rather than a crash.
The psychological element is equally important. Crashes spark panic selling, record trading volumes, and emergency measures like circuit breakers and trading halts. Financial media shift into nonstop coverage, amplifying fear and volatility. Ultimately, a crash is defined not just by the depth of losses, but by the speed and emotion driving them.
Speed and Severity: The Dual Indicators
Historical research shows that the speed of a decline can matter more than its total size when defining a true market crash. A drop of around 10% within two or three days is enough to grab investor attention, as seen in March 2020, when the S&P 500 fell more than 7% multiple times, triggering circuit breakers to curb panic selling.
A 15% slide within a week moves markets into serious-concern territory. When losses reach 20% over a compressed period, whether days or weeks, history suggests a shift from correction to crash, often signaling broader systemic or economic stress. In short, crashes are defined not only by depth but by the velocity of fear that drives them.
Beyond the Numbers: Warning Signs That Matter
Savvy investors track more than just headline index movements. Several key indicators can help distinguish between a routine correction and a developing market crisis.
Market breadth tells an early story. In a normal correction, some stocks fall while others remain resilient. During a crash, nearly all sectors drop together. When over 80–90% of stocks decline simultaneously, as seen in episodes like March 2020, it signals broad capitulation rather than sector-specific weakness.
Volatility patterns also shift dramatically. The CBOE Volatility Index (VIX), often called Wall Street’s “fear gauge,” typically trades below 20 during stable periods. In major sell-offs, it can surge above 50, as it did in October 2008 and March 2020. More telling than the absolute level is the speed of the move, when the VIX doubles within days, it reflects escalating panic across markets.
Credit markets often flash warnings before equities. When corporate bond spreads widen sharply or overnight lending rates such as the SOFR spike, it suggests institutional investors are pulling back from risk. The 2008 financial crisis, for instance, was preceded by months of mounting stress in credit markets that many equity traders initially overlooked.
What Should Investors Actually Do?
Here’s the uncomfortable truth: by the time you’re certain a crash is happening, it’s usually too late to react effectively. Research consistently shows that investors who try to time market crashes often lock in losses and miss the strongest recovery days.
Historical data supports this. Studies Morgan Stanley reveal that missing just the best 10 days in the market over several decades can cut long-term returns by nearly half. Many of those best days occur during or immediately after crashes, precisely when fearful investors are on the sidelines.
That doesn’t mean crashes should be ignored. Instead, investors should focus on preparation and discipline.
Before a crash: Build a portfolio aligned with your true risk tolerance and time horizon. If a 20% drop would cause panic, you’re likely taking too much risk. Keep a reasonable mix of stocks, bonds, or cash depending on when you’ll need the funds.
During a crash: Resist the urge to check your portfolio constantly. Behavioral finance research shows that frequent monitoring increases anxiety and leads to poor decisions. If your investment horizon is long, market downturns often present buying opportunities, not selling signals.
Source: HF
After a crash: Review what happened, but don’t overcorrect. Many investors shift too heavily into cash or bonds right before markets recover. Staying disciplined and maintaining a long-term view remains the most effective way to build wealth through volatility.
The Role of Portfolio Structure
Your ability to withstand a market crash depends more on portfolio construction than on predicting when one will happen.
Diversification remains the most reliable defense. A balanced mix of U.S. stocks, international stocks, bonds, and perhaps real estate or commodities may still decline during a crash, but far less than an all-stock portfolio.
Rebalancing during downturns requires discipline but adds long-term value. When stocks fall and bonds hold steady, selling bonds to buy stocks at lower prices enforces a “buy low, sell high” approach that improves returns over time.
An emergency fund separate from investment accounts provides critical stability. Knowing you can cover several months of expenses without touching investments removes pressure to sell at the worst time and helps you stay invested through volatility.
Perspective on Market Crashes
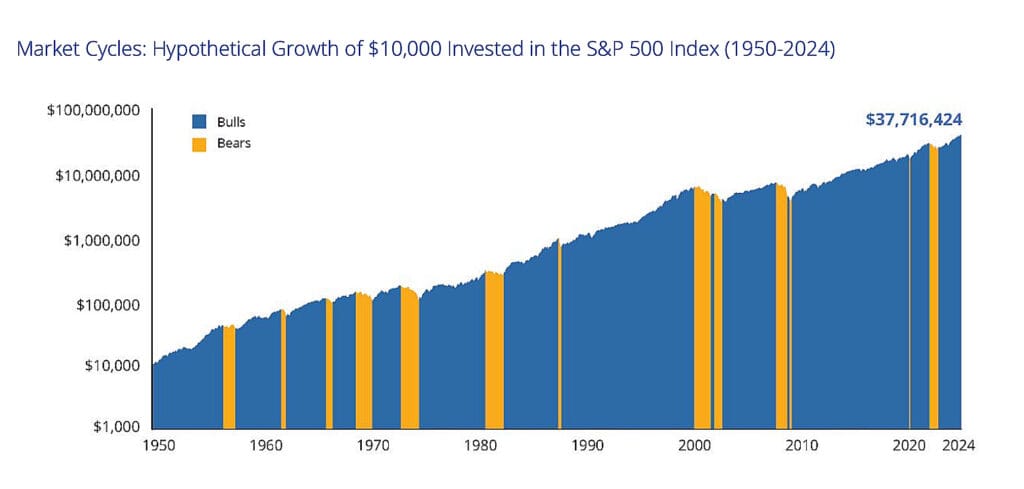
Despite their drama and pain, market crashes are temporary events in the long arc of market history. The S&P 500 has endured multiple crashes and bear markets over the past century, including 1929, 1987, 2000–2002, 2008, and 2020. Yet over the long term, returns have remained strongly positive for investors who stayed invested through the turbulence. From 1928 to 2024, the S&P 500 delivered an average annual return of around 9–10%, despite repeated downturns and recessions.
This doesn’t minimize the real hardship that crashes can cause. For individuals retiring during the 2008 Global Financial Crisis or needing to liquidate assets during the 2020 COVID-19 market crash, the timing was genuinely unfortunate. But for most investors with decades until retirement, these downturns represent temporary setbacks rather than permanent destruction of wealth.
The investors who suffer most from crashes aren’t those who experience the declines, since everyone in the market does, but those who panic and sell at the bottom. Selling during a crash converts temporary paper losses into permanent realized losses, undermining the very recovery that historically follows every major downturn.
Recognizing vs. Reacting
Understanding when a market decline becomes a crash helps investors interpret events and respond rationally. A 5% pullback is generally viewed as normal market noise and rarely requires action. A 10% drop qualifies as a correction, a good time to review portfolio allocations. But a 20% decline over a few weeks typically signals the onset of a bear market or crash, often driven by systemic fear or economic stress.
However, recognition should not automatically lead to reaction. The goal isn’t to avoid every downturn, that’s virtually impossible and often leads to missing strong rebounds. The real objective is to build a resilient portfolio that can endure market shocks, stay disciplined during volatility, and avoid panic-selling that converts temporary losses into permanent ones.
History shows that long-term success in investing rarely comes from timing the market but from maintaining a consistent, well-structured strategy. Those who stay invested and rebalance thoughtfully through turbulence often emerge stronger when recovery begins.
This article is part of Mooloo’s Market Cycles & Risk sub-hub, which explains how financial markets behave across economic cycles, stress events, and systemic uncertainty without relying on forecasts or timing narratives.