The Santa Claus Rally and Holiday Market Patterns – Myth or Reality?

The Santa Claus rally refers to a historically favorable seven-trading-day window, the last five trading days of December and the first two of January, when U.S. stocks have risen roughly 75% of the time since 1950, averaging about 1.3%. While this pattern is well-documented and driven by year-end trading dynamics, it is not a reliable signal or strategy. The failure of the Santa Claus rally in late December 2024 to early January 2025, one of the weakest performances since 2015–2016, reinforces that seasonal tendencies can be overwhelmed by macro forces such as monetary policy, interest rates, inflation expectations, and investor positioning. The rally is best viewed as a historical tendency that helps interpret market behavior, not as a tradeable edge.
- Definition matters: The Santa Claus rally is narrowly defined as the last five trading days of December plus the first two of January, not the entire month or a generic year-end bounce.
- Historical edge, not a guarantee: The rally has delivered positive returns about three-quarters of the time since 1950, but it fails often enough to make trading it unreliable.
- Why it happens: Lower trading volume, reduced institutional selling, year-end tax timing, and residual inflows have historically tilted prices higher in late December.
- 2024 was a clear exception: A hawkish Fed outlook, rising Treasury yields, profit-taking, and inflation concerns overpowered seasonal tailwinds.
- Investor takeaway: Seasonal patterns provide context, not signals, long-term discipline, diversification, and fundamentals matter far more than a seven-day calendar effect.
As December arrives and holiday decorations appear, investors often talk about the “Santa Claus rally”, a seasonal tendency for U.S. stocks to rise during the last five trading days of December and the first two trading days of January. The idea has been tracked for decades (popularized in the early 1970s), but it’s best treated as a historical pattern rather than a dependable signal.
The Santa Claus rally is often linked to year-end trading dynamics, lighter volumes, portfolio positioning, and shifting flows, yet it does not show up every year. In the late-December 2024 to early-January 2025 window, the rally failed to materialize, and some market coverage described it as the weakest performance for this period since 2015–2016, underscoring that even well-known seasonal tendencies can break when broader forces dominate.
Defining the Santa Claus Rally
The Santa Claus rally is a well-established stock market seasonal pattern describing the tendency for equity prices to rise during a specific seven-trading-day window: the last five trading days of December and the first two trading days of January. This definition has been consistently used in market research for more than five decades.
The term was introduced by Yale Hirsch in the early 1970s through his work documenting historical market seasonality. His research formalized the concept and distinguished this brief period from broader year-end or January performance, focusing specifically on this tightly defined trading window.
Because Christmas and New Year’s Day fall on different weekdays each year, the exact calendar dates shift slightly, but the structure of the period does not. In most years, the rally begins around December 26 and extends into the first or second trading session of January, depending on market holidays.
Historically, this seven-day period has delivered average gains of roughly 1.3%, a notable return compressed into just one week of trading. While annualizing such a short-term gain would imply unrealistic year-long returns, the significance lies in the frequency and consistency of positive outcomes rather than compounding potential.
Long-term market data shows that the Santa Claus rally has produced positive returns roughly three-quarters of the time since 1950, a success rate meaningfully higher than that of random seven-trading-day periods throughout the year. This consistency has made it one of the most persistent and closely studied seasonal effects in equity markets.
Further analysis confirms that no other seven-trading-day window on the calendar combines both a higher probability of gains and a comparable average return. While the rally does not occur every year and offers no guarantee of future performance, its historical record places it among the most statistically distinctive short-term patterns observed in stock market history.
Source: Carson
Why Santa Comes to Wall Street
Several structural factors tend to align in late December, creating conditions that have historically supported higher stock prices. Unlike many seasonal market theories, the Santa Claus rally is largely explained by observable changes in trading behavior rather than speculation.
- One key driver is reduced trading volume: During the final week of the year, many institutional investors and professional traders are on holiday, leading to thinner liquidity. In low-volume environments, even modest buying pressure can have a larger impact on prices, allowing markets to drift higher more easily than during normal trading periods.
- Retail investor activity can add incremental demand: Individual investors continue to trade through the holidays, and late December often coincides with year-end bonuses and retirement contributions. While these inflows are relatively small, they can influence prices when institutional selling pressure is muted.
- Year-end portfolio adjustments also matter: Much of December’s rebalancing and “window dressing” activity concludes before the final trading days, reducing selling pressure. Any remaining cash deployment or passive inflows can continue into year-end, supporting prices.
- Tax considerations further shape behavior: Investors seeking to realize capital losses typically sell earlier in December, while those with unrealized gains often delay selling until January to defer taxes. This imbalance can reduce late-December selling activity.
Together, these factors help explain why late December has historically been more favorable for stock prices, without suggesting the pattern is reliable or guaranteed.
December’s Broader Strength
The Santa Claus rally occurs within a long-standing seasonal pattern that makes December one of the strongest months for U.S. stocks. Since 1950, December has ranked among the top-performing months, with average S&P 500 gains of roughly 1.4%–1.6%. While rankings vary by period, December’s overall strength is consistent across decades.
What sets December apart is its reliability. Historically, the S&P 500 has posted positive returns in December about 73%–75% of the time, the highest win rate of any calendar month. This means December delivers gains nearly three years out of four, reinforcing its reputation as the market’s most dependable month.
December returns are also back-loaded. Market gains tend to concentrate in the second half of the month, especially during the final ten trading days. The first half of December is often flat or mildly negative before year-end momentum builds, which explains why the Santa Claus rally captures a large share of December’s total gains despite its short duration.
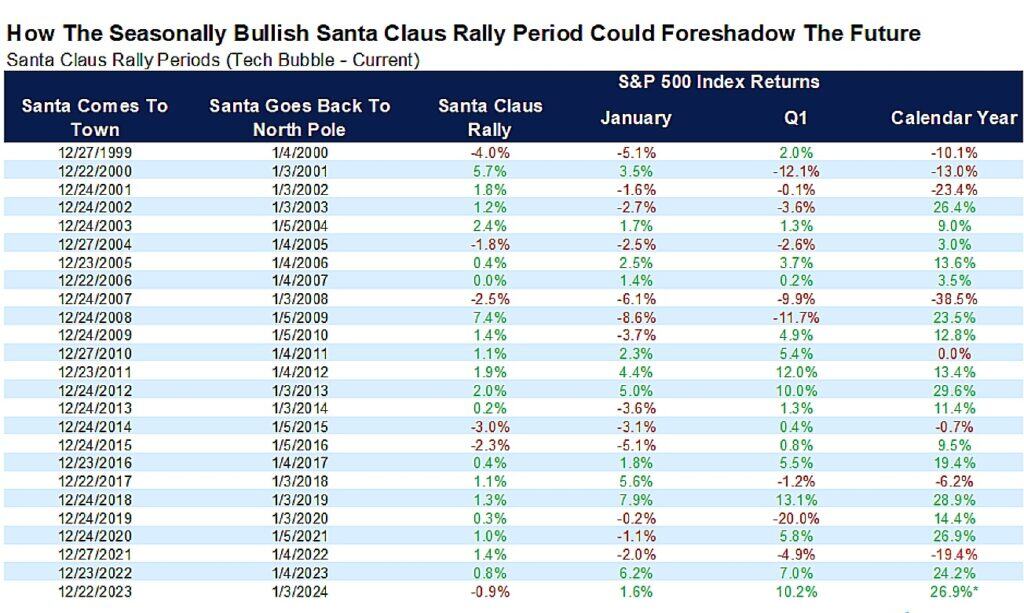
Historical extremes highlight this dynamic. The strongest Santa Claus rally occurred at the end of 2008 and start of 2009, when the S&P 500 rose about 7.4% during the seven-day window. A similarly strong rebound followed at the end of 2018 after a sharp fourth-quarter selloff. These episodes suggest Santa Claus rallies often reflect relief rallies from oversold conditions, rather than straightforward trend continuation.
The 2024 Exception
December 2024 served as a clear reminder that even highly consistent seasonal patterns can fail. The S&P 500 fell about 2.4% in December, marking only the third monthly decline of the year, after a strong rally earlier in 2024. Despite that late-year weakness, the index still finished 2024 with an annual gain of roughly 23.3%, underscoring how unusual the December pullback was within an otherwise strong year.
More notably, the market failed to deliver a Santa Claus rally. The traditional Santa Claus rally period, the last five trading days of December and the first two trading days of January, has historically produced positive returns nearly 80% of the time since 1950, with an average gain of around 1.3%. In 2024–2025, that pattern broke decisively.
Instead of rising, the S&P 500 declined on every trading day between Christmas and New Year’s, creating what is often described as a reverse Santa Claus rally. This outcome is extremely rare and contrasts sharply with the historical tendency for year-end strength during this period.
Several forces contributed to the breakdown. The Federal Reserve’s December policy outlook was more hawkish than markets had anticipated, signaling fewer interest-rate cuts in 2025. At the same time, Treasury yields moved higher, increasing the relative appeal of fixed-income investments and drawing capital away from equities. Inflation concerns also resurfaced, despite earlier signs of moderation, adding further pressure to risk assets.
Market positioning amplified the move. After substantial gains throughout most of 2024, many investors chose to lock in profits before year-end rather than carry exposure into January. Tax considerations also played a role, as realized gains were already sizable, reducing incentives to delay selling into the new year.
The 2024 failure reinforces a key market principle: seasonal patterns reflect historical tendencies, not guarantees. When macroeconomic headwinds, monetary policy, interest rates, inflation, and valuation pressures, align against equities, even the most reliable calendar effects can be overwhelmed.
International Patterns
The Santa Claus rally isn’t limited to U.S. markets. Germany’s DAX index also benefits from seasonal tailwinds during December and early January, with the rally typically beginning December 14 and extending until January 6. Over the past 44 years, the DAX delivered an average return of 2.85% during this period, occurring in 34 of 44 years.
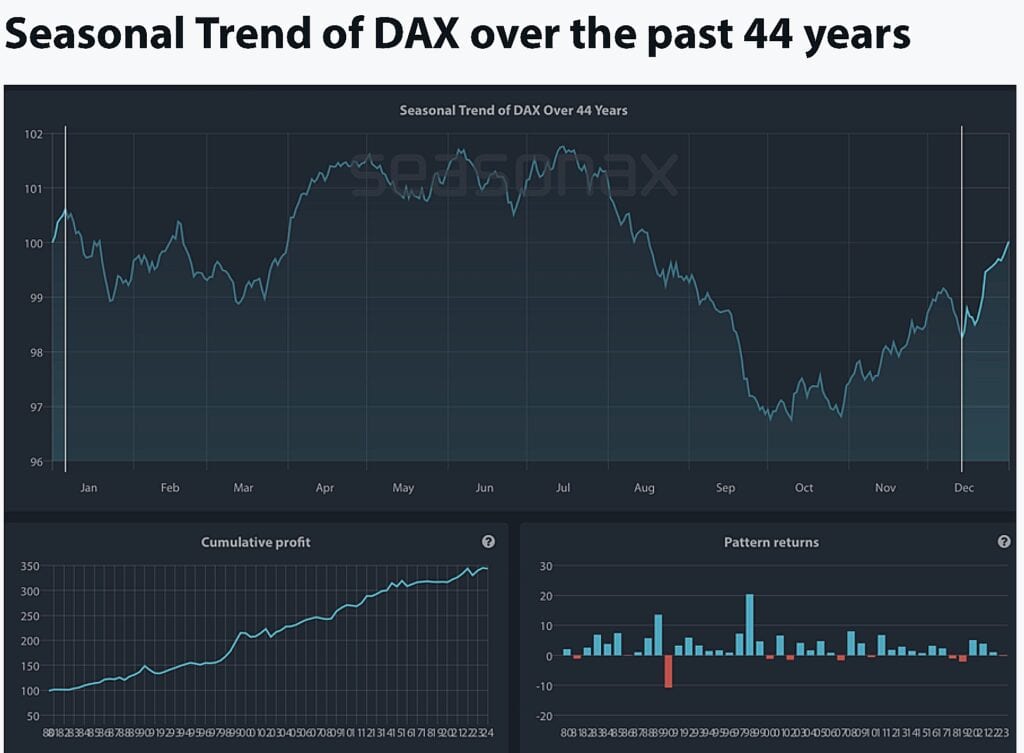
Source: Seasonax
The slightly longer window for the DAX, beginning earlier in December, reflects different market structures and holiday schedules in European markets. However, the underlying dynamics remain similar: reduced trading volume during holidays, year-end institutional activity, and tax-related positioning.
The pattern’s international presence strengthens the case that genuine factors drive the effect rather than coincidence or data mining. When independent markets in different countries with different fiscal calendars show similar year-end patterns, it suggests real behavioral and structural causes rather than statistical flukes.
The Predictive “If Santa Fails to Call”
Wall Street lore suggests that a failed Santa Claus rally can precede tougher market conditions. Yale Hirsch famously summarized this idea with the line: “If Santa should fail to call, bears may come to Broad and Wall.” The saying reflects an observed tendency rather than a causal rule, but history shows why the warning gained attention.
Several notable market downturns were preceded by absent or weak Santa Claus rallies. The failure at the end of 1999 came just before the dot-com collapse in 2000. Similarly, the lack of a year-end rally in late 2007 preceded the 2008 global financial crisis. In these cases, the missing rally did not cause the bear markets, but it coincided with growing macroeconomic stress that later intensified.
However, the pattern is far from reliable. The end of 2022 failed to produce a Santa Claus rally, yet 2023 delivered strong equity gains, demonstrating that the signal can generate false warnings. This inconsistency highlights the limits of using seasonal patterns as predictive tools.
The potential insight lies not in the rally itself, but in why it fails. Late December typically benefits from reduced selling pressure and seasonal inflows. When selling dominates instead, it can reflect elevated investor caution, unresolved macro risks, or tightening financial conditions. In that sense, a failed Santa rally is better viewed as a symptom of underlying concern, not a dependable forecast of future market performance.
Practical Implications for Investors
For beginner investors, the Santa Claus rally offers lessons that extend beyond the narrow seven-trading-day window itself. December has historically ranked among the stronger months for U.S. equities on average, though results vary widely by year. This historical tendency suggests that panic-selling late in the year, especially after earlier volatility, has often worked against long-term investors. Staying invested through year-end has generally aligned better with long-term market behavior than moving to cash purely for seasonal reasons.
Second, while the Santa Claus rally has occurred more often than not over long historical samples, it is far from guaranteed. Depending on the data set and time period used, the rally has appeared in roughly three-quarters of observed years, not every year, and not with consistent magnitude. That failure rate matters. Any strategy focused on a single seven-day period concentrates risk and exposes investors to outcomes that are highly sensitive to short-term market conditions rather than fundamentals.
Third, the forces commonly associated with the Santa rally, lower trading volume, reduced institutional participation, and year-end tax positioning, do not exclusively favor higher prices. Reduced liquidity can amplify volatility in either direction. When participation is thin, relatively modest selling pressure can produce outsized declines, just as buying can push prices higher. Recent years have demonstrated that the same conditions often cited to explain year-end strength can also contribute to unexpected weakness.
Finally, attempting to trade the Santa Claus rally introduces practical frictions that tend to overwhelm any theoretical edge. Transaction costs, bid-ask spreads during low-liquidity periods, tax implications, and timing risk all erode returns. By the time the rally window begins, much of the positioning has already occurred. Entering late and exiting precisely on schedule requires accuracy that most investors, professional or otherwise, rarely achieve. For long-term investors, disciplined allocation and time in the market have proven far more reliable than chasing short seasonal patterns.
The Broader Context
The Santa Claus rally fits within November and December’s combined strength, which represents the most favorable two-month period for equities. November has averaged 5.7% gains in recent periods and ranks as the strongest month, with December’s 1.6% average providing a solid finish. This two-month combination has delivered consistent gains across decades.
However, six-month returns from December through May show mixed patterns, ranking as the worst six-month window over the past 10 years but the third-best over all periods since 1950. This divergence suggests seasonal patterns evolve over time, with recent decades showing different dynamics than earlier periods.
For investors focused on long-term wealth building, the Santa Claus rally represents an interesting footnote rather than an actionable strategy. Its existence confirms that markets exhibit patterns beyond random noise. Its limitations, it fails one year in five, involves just seven days, and can’t be reliably traded, confirm that seasonal knowledge rarely translates to superior returns after accounting for costs and risks.
Understanding the Santa Claus rally helps you interpret market movements during holiday periods. When markets rise in late December, recognize this aligns with historical norms rather than signaling exceptional conditions. When markets fall during this typically strong period, as in 2024, acknowledge that something unusual is occurring that may warrant attention to fundamentals.
The holiday season will continue producing headlines about Santa Claus rallies, whether they materialize or fail. The pattern has persisted long enough to earn recognition as a real phenomenon driven by identifiable factors. It hasn’t persisted reliably enough to justify changing your investment approach. Stay invested, stay diversified, and let seasonal patterns unfold without trying to trade around them. That approach consistently delivers better outcomes than attempting to catch Santa’s sleigh for a seven-day ride.