The 3 Market Metrics Worth Monitoring (Even If You Ignore Everything Else)

1. The VIX: Wall Street’s Fear Gauge
The VIX (Cboe Volatility Index) measures the market’s expected volatility for the S&P 500 over the next 30 days, derived from option prices. When investors seek protection by buying options, the VIX rises; when they’re calm, it falls.
What the numbers mean:
- 12-20: Normal, calm markets
- 25-35: Elevated concern, potential correction zone
- Above 40: Panic levels, signaling extreme market stress
The VIX surged above 80 during both the March 2020 COVID-19 crash (peaking at 82.69) and the 2008 financial crisis (intraday high 89.53). In tranquil periods, it typically trades in the low-to-mid teens, with the long-term average near 20.
The key insight is the pace of change. A sharp rise, say, from 15 to 35 in a few days, signals rapidly escalating fear, while a gradual drift higher is less alarming.
Where to check it: The Cboe publishes the VIX in real time, and it’s also available on Yahoo Finance, Bloomberg, and MarketWatch.
What not to do: Don’t trade solely on VIX moves. It’s a thermometer, not a thermostat, measuring market temperature, not controlling it.
2. Market Breadth: What’s Happening Below the Surface
The S&P 500 can appear strong even when most stocks are weak because it’s market-cap weighted, a few mega-cap technology stocks can keep the index elevated while hundreds of smaller companies decline.
To understand the true health of the market, investors monitor market breadth, which shows how many stocks are participating in the move. The most widely followed metric is the percentage of stocks trading above their 200-day moving average, a long-term trend indicator.
What the numbers mean:
-
50–70% = Healthy, broad participation
-
30–50% = Weakening trend
-
Below 30% = Serious deterioration
-
Below 20% = Crash-level weakness
In bull markets, most S&P 500 stocks stay above their 200-day average. During the March 2020 COVID crash, this figure dropped below 10%, and during the 2022 bear market, it remained depressed for months.
Market breadth reveals whether market strength is widespread or concentrated. If the S&P 500 nears record highs but only 40% of its components trade above their 200-day average, that’s a red flag, few stocks are driving the gains, which is often unsustainable.
Where to check it: You can track this data in real time on platforms like StockCharts and Finviz, or through breadth tools offered by major brokerages.
What not to do: Breadth isn’t a perfect timing signal, it can weaken long before markets correct, but it provides vital context on whether market momentum is solid or hollow.
3. Credit Spreads: What the Smart Money Sees
While retail investors focus on stock prices, bond investors often detect trouble first. Credit spreads measure the difference between what risky borrowers pay to borrow money and what the U.S. government pays on Treasury bonds. When these spreads widen, bond investors are demanding higher returns to compensate for perceived risk, a warning sign that risk appetite is fading.
The key metric: the high-yield (or “junk bond”) spread over Treasuries. This indicator shows how much extra yield investors require to hold lower-quality corporate debt instead of government bonds.
What the numbers mean:
- 3–4 percentage points: Normal conditions
- 5–7 percentage points: Elevated caution
- Above 8–10 percentage points: Severe stress
Historically, these ranges have marked key turning points. During the 2008 financial crisis, high-yield spreads surged above 18 percentage points as credit markets froze. In March 2020, they spiked above 10 points before Federal Reserve intervention calmed markets. Similar patterns often appear before major equity sell-offs, credit markets typically signal distress ahead of stocks.
What it tells you: Credit spreads reflect how institutional investors perceive financial stability and default risk. When spreads widen, the bond market is flashing caution about the economic outlook.
Where to check it: The Federal Reserve’s FRED database tracks U.S. high-yield spreads in real time, and most brokerages provide this data under their fixed-income or bond-market sections.
How to Use These Three Together
The real power comes from tracking all three indicators at once, since each measures a different aspect of market health:
-
VIX captures immediate fear and expected volatility.
-
Market breadth shows whether strength or weakness is widespread.
-
Credit spreads reflect whether professional bond investors see systemic risk.
Scenario 1: The S&P 500 drops 8% in a week
VIX: 28
Breadth: 45% of stocks above 200-day MA
Credit spreads: 4.5%
Interpretation: This resembles a normal correction. The VIX is elevated but below panic levels, breadth has weakened moderately, and credit spreads remain contained. Markets show stress, not crisis.
Scenario 2: The S&P 500 drops 8% in a week
VIX: 52
Breadth: 18% of stocks above 200-day MA
Credit spreads: 9%
Interpretation: This setup signals danger. The VIX indicates panic-level fear, breadth shows widespread selling, and credit spreads suggest institutional concern about financial stability. This combination mirrors conditions seen before major crashes like 2008 or March 2020.
Scenario 3: The S&P 500 is flat to slightly up
VIX: 16
Breadth: 35% of stocks above 200-day MA
Credit spreads: 6%
Interpretation: Headline indexes look stable, but the internals tell a different story. Narrow breadth and rising credit spreads point to underlying weakness not yet reflected in large-cap prices. This is a yellow flag, conditions that often precede deeper market pullbacks.
The Important Caveat
Even with these three reliable indicators, the biggest challenge remains market timing. Recognizing that conditions are deteriorating doesn’t reveal when markets will fall or how deep the decline will be. The VIX can remain elevated during short-lived corrections, and credit spreads may widen for months before equities react.
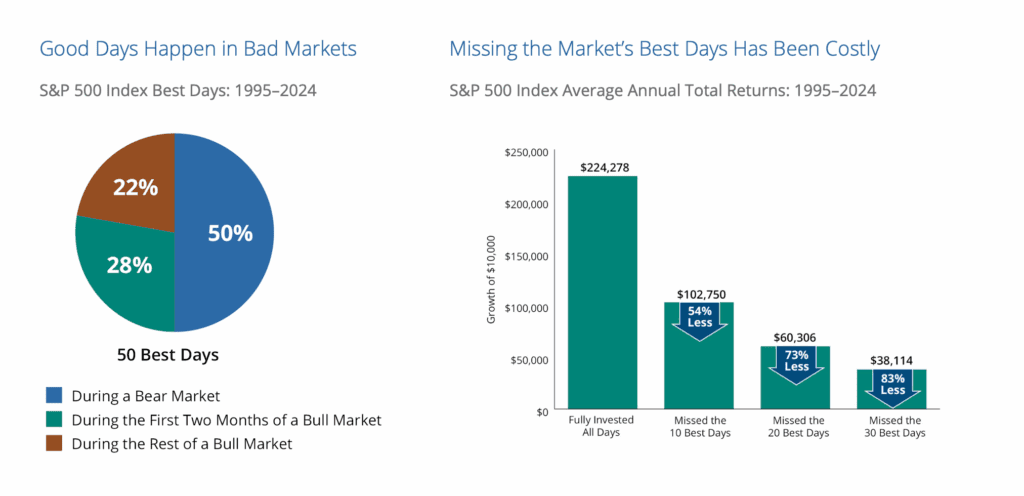
Trying to trade or significantly adjust your portfolio based on these signals often results in selling near market bottoms and buying back at higher prices. Historical research consistently shows that investors who attempt to time the market tend to underperform those who stay invested through volatility, as missing the best days can severely reduce long-term returns.
Source: HF
The Real Value: Context, Not Timing
So why monitor these metrics if not to time the market? Because they provide essential context. They help you interpret market movements, manage emotions, and avoid both panic and complacency.
When markets drop and all three indicators flash danger, it’s not a cue to panic-sell, you’re probably late anyway. But it is a sign to reassess your risk exposure and ensure your portfolio matches your tolerance for volatility.
When prices fall but these indicators remain stable, you’re likely witnessing normal market fluctuations rather than the start of a crisis. That understanding can prevent unnecessary changes to your long-term strategy.
And when markets look calm while these indicators quietly weaken, it’s a reminder to stay cautious. Conditions may be deteriorating beneath the surface, making it wise to avoid taking on extra risk or becoming overly confident.
The purpose isn’t prediction, it’s perspective. These signals help you stay grounded, disciplined, and ready for whatever the market delivers next.
A Practical Monitoring Schedule
To get real value from these market indicators, consistency matters more than frequency.
Weekly check: Review all three metrics, VIX, market breadth, and credit spreads, once a week, ideally on Sunday evening or Monday morning. Identify whether each is in normal, elevated, or crisis territory. You can do this in about five minutes using reliable sources like CBOE, StockCharts for breadth data, and Federal Reserve FRED for credit spreads.
Monthly review: Examine how these indicators have trended over the past month. Look for clear direction, are conditions stabilizing or deteriorating?
Only check more often if: One or more metrics enter crisis territory (e.g., VIX above 40, breadth below 20%, or credit spreads above 8%). Even then, daily monitoring usually adds stress without improving decision-making.
The goal isn’t constant vigilance, it’s informed awareness: staying alert to major shifts without overreacting to every market move.
The Bottom Line
If you monitor only a handful of market indicators, make them the VIX, market breadth, and credit spreads. Together, they offer a clear snapshot of investor sentiment, internal market strength, and institutional risk perception, without drowning you in noise.
The key is not to trade on these signals, but to understand what they mean. When the VIX spikes, breadth collapses, or credit spreads widen, it’s a sign to review your risk exposure, not to panic. Likewise, when they remain steady during market turbulence, it’s reassurance that volatility is likely temporary.
Used properly, these metrics anchor your perspective. They remind you that successful investing isn’t about timing every move, it’s about maintaining composure, context, and conviction through every market cycle.
About this topic
This article forms part of Mooloo’s investing education series, which explains how markets work, how risk and returns are generated, and how investors can make better long-term decisions.
Learn more in our How Investing Works guide.