Market Corrections vs. Crashes: Recognizing Normal Volatility in Any Season

If your portfolio is down about 10%–15%, history strongly suggests you’re most likely experiencing a normal market correction, not the beginning of a crash. Corrections of roughly 10%–20% occur about every 1–2 years, often recover within months, and have frequently happened even in years when markets ultimately finished higher. The uncomfortable reality is that investors can’t know in real time whether a decline will stop at 10% or deepen further, which is precisely why disciplined, pre-planned responses have historically mattered more than prediction.
- Most declines are corrections, not crashes: Pullbacks under 10% happen in most years, and 10%–20% corrections occur regularly without lasting damage to long-term returns.
- Bear markets are rarer and slower: Declines of 20% or more typically occur every 4–5 years on average and often coincide with economic stress, but they have still historically recovered over time.
- Recovery often begins before conditions feel “safe”: Markets have repeatedly rebounded while headlines and economic data still looked grim.
- Staying invested has mattered more than timing: Investors who sold during corrections have frequently missed sharp rebounds that followed shortly after.
- Preparation beats prediction: A written plan for 10%, 15%, and 20% drawdowns reduces emotional decisions when volatility hits.
Your portfolio is down 12% from its peak. Financial media fills with headlines about market turmoil. Friends at dinner debate whether it’s time to sell everything. Your stomach tightens every time you check your account balance. The question running through your mind is unavoidable: Is this a normal correction, or the beginning of something much worse?
For beginner investors, this situation often triggers intense anxiety. Without historical context or firsthand experience navigating market downturns, every decline can feel catastrophic. Understanding the difference between market corrections, bear markets, and crashes, and knowing how to respond to each, is essential for long-term investing success.
The reality is reassuring. Most market declines are corrections, not crashes. Historically, corrections, typically defined as declines of about 10–20%—are common, temporary, and have tended to recover relatively quickly. Even full bear markets and rare market crashes have eventually reversed, with disciplined investors rewarded over time.
The difficult truth is that you cannot know which type of decline you’re experiencing while it’s happening. That uncertainty is precisely why a consistent, disciplined response matters more than trying to predict the outcome in real time.
Defining the Declines
Market participants use widely accepted thresholds to categorize different types of market declines. These are not official definitions enforced by regulators, they are conventions developed over decades of market observation. Understanding these categories helps investors contextualize what they’re experiencing and respond appropriately.
A correction is generally defined as a decline of 10% to 20% from recent highs. The term is intentionally neutral rather than alarming, these moves are seen as markets “correcting” excess valuations or overly optimistic sentiment. Historically, corrections are shorter than bear markets. Data compiled by major market researchers shows the average correction reaches its low in roughly 3–5 months and recovers in about 4 months, though individual episodes vary meaningfully.
A bear market occurs when major indexes fall 20% or more from recent peaks. Since the mid-20th century, U.S. bear markets have lasted about 12–15 months on average from peak to trough, though durations vary widely. Some unfold slowly over years, while others are brief but severe. The 2020 pandemic bear market, for example, lasted just 33 days, making it the shortest on record despite its sharp decline.

Source: Schwab
A crash has no formal numerical definition. The term generally refers to sudden, violent declines occurring over days or weeks rather than months. The defining feature is speed. In October 1987, the U.S. stock market fell 22.6% in a single day. The 1929 crash unfolded over several weeks, with multiple extreme down days. Crashes are typically associated with panic selling and often prompt emergency policy or market-structure responses.
Declines of less than 10% are commonly described as pullbacks or dips. These represent normal market volatility and occur frequently, often multiple times in a single year, without signaling deeper economic or market stress.
How Often They Occur
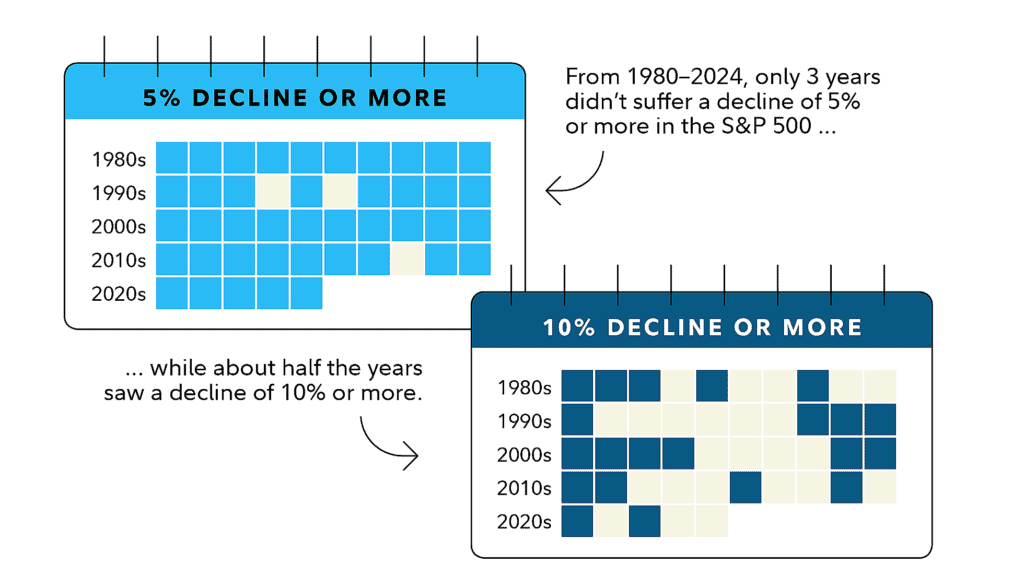
Understanding frequency helps calibrate expectations. Markets are not smooth upward trajectories, they are volatile and regularly experience setbacks of varying magnitudes. Since 1980, the S&P 500 has recorded a pullback of at least 5% in roughly 90% of calendar years, and a decline of 10% or more in about 45–50% of years. These events are not anomalies; they are a normal feature of equity investing.
Source: Fidelity
Looking more closely, market corrections (declines of 10–20%) have historically occurred about once every 1.5 to 2 years on average. The timing is irregular, some decades see clusters of corrections, while others go several years without one. Over the past few decades, a majority of calendar years have experienced at least one 10% drawdown at some point during the year, reinforcing the idea that intra-year volatility is routine rather than exceptional.

Source: Covenant
From 2002 through 2021, approximately half of all calendar years experienced a drawdown of 10% or more, with the average intra-year decline landing in the mid-teens. Despite these pullbacks, the market finished positive in the large majority of those years, highlighting an important reality: significant intra-year declines do not reliably predict negative full-year returns. Markets often recover from mid-year stress and still end the year higher.
Bear markets (declines of 20% or more) are meaningfully less frequent than corrections, historically occurring about once every four to five years on average. That average, however, conceals wide variation. The expansion following the 2008–09 financial crisis ran for more than a decade before the brief pandemic bear market of 2020, while earlier periods, such as the 1970s or early 2000s, experienced multiple bear markets in relatively short succession.
The takeaway is clear: volatility is not a sign that markets are broken. It is the cost investors pay for long-term returns, and frequent pullbacks are a feature of equity markets, not a warning signal by themselves.
The Recovery Pattern
For investors experiencing a decline, recovery timing matters as much as frequency. How long until your portfolio regains lost ground? How much further might it fall before turning? These questions have no precise answers for any specific decline, but historical patterns provide useful context.
Historically, smaller declines recover relatively quickly. Pullbacks of 5% to 10% have typically recovered in around three months on average, while 10%–20% corrections have taken roughly six to nine months to regain prior highs. Bear markets, defined as declines of 20% or more, take longer, often requiring one to several years to fully recover, depending on severity.
These averages hide wide variation. Some corrections recover in weeks, while others take more than a year. The 2020 pandemic bear market fell about 34% peak-to-trough and recovered to prior highs in roughly five months. By contrast, following the 2007–2009 financial crisis, the market did not fully recover its prior peak until 2013, more than four years later.
Recovery timing is difficult to predict because markets bottom when conditions stop worsening, not when conditions look good. Historically, strong rallies often begin amid weak economic data, high unemployment, and widespread pessimism. Waiting for clear confirmation of improvement has often meant missing a meaningful portion of the recovery.
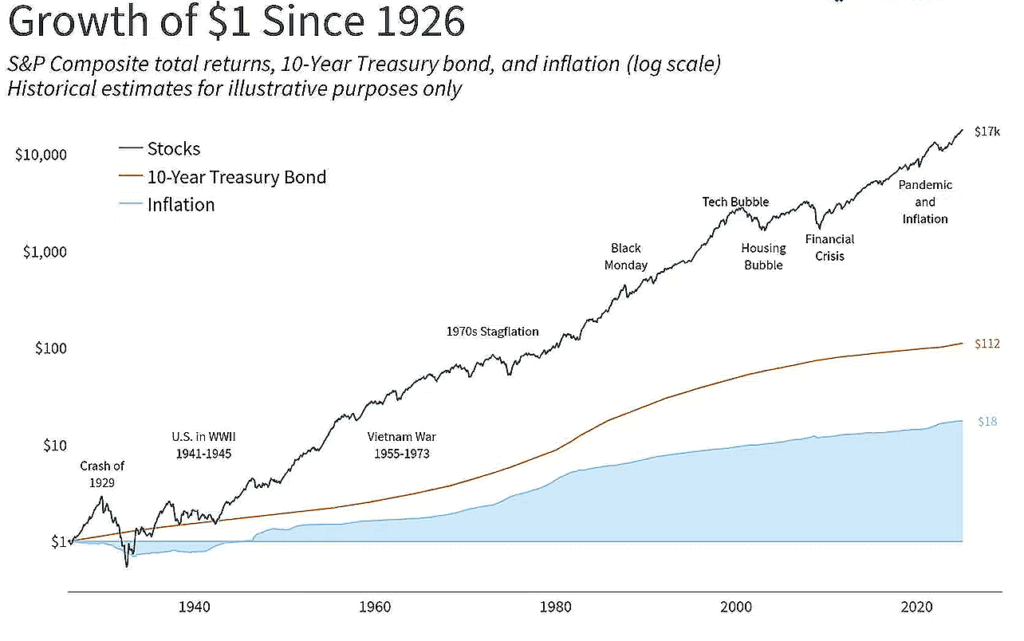
Despite repeated crashes and recessions, markets have recovered from every major decline. A single dollar invested in the S&P 500 at the start of 1926 would have grown to roughly $17,000 by early 2025, despite wars, depressions, inflationary periods, financial crises, and a global pandemic.
Source: Covenant
The takeaway is simple: short-term recoveries are unpredictable, but long-term market progress has been persistent.
The 2024 Example
August 2024 provided a recent and instructive example of a market pullback. U.S. equities had risen steadily through the first seven months of the year, with the S&P 500 up approximately 18% year-to-date by late July. In late July and early August, volatility increased and prices declined by about 9.9% from peak to trough, narrowly missing the conventional 10% correction threshold but coming close enough to trigger widespread investor concern.
The decline reflected a convergence of factors rather than a single catalyst. Economic data showed signs of moderating growth, corporate earnings results were mixed, geopolitical tensions remained elevated, and investors engaged in profit-taking following the strong first-half rally. Financial media coverage intensified during this period, raising questions about whether the pullback signaled the beginning of a deeper downturn or simply a normal pause after rapid gains.
By late August, markets had recovered most of the losses incurred earlier in the month. The upward trend resumed through September and into November. November delivered the strongest monthly performance of the year, with gains of roughly 6%. Investors who sold during the August volatility missed both the late-August recovery and the November rally. Those who stayed invested, or rebalanced by adding exposure at lower prices, benefited from the subsequent advance.
This episode reinforced several well-established principles. First, not every decline in the 8%–10% range develops into a full correction or bear market. Second, market reversals can occur quickly, making exit-and-reentry strategies extremely difficult to execute successfully. Third, maintaining discipline during periods of discomfort has historically been rewarded, while panic-driven decisions during volatility have tended to reduce long-term returns.
Why Corrections Happen
Understanding why market corrections occur helps investors respond rationally rather than emotionally. Corrections are not market failures, they are a normal and recurring feature of healthy equity markets.
- Valuation resets happen when stock prices rise faster than underlying business fundamentals. When valuation metrics such as price-to-earnings ratios move well above long-term historical averages, markets often correct to bring prices back toward sustainable levels. This reset allows future returns to be driven more by earnings growth than by expanding valuation multiples.
- Sentiment adjustments follow periods of extreme optimism or pessimism. When bullish sentiment becomes widespread and risk awareness fades, markets become more vulnerable to pullbacks. Conversely, when pessimism reaches extremes, markets often rebound as sentiment improves from very negative to less negative, often before economic data clearly turns.
- Profit-taking creates technical corrections. After strong market rallies, investors naturally sell to lock in gains. When selling activity becomes concentrated, prices decline until buyers re-enter at lower valuations. These corrections can occur even when corporate earnings and economic conditions remain intact.
- External shocks introduce short-term uncertainty. Policy changes, geopolitical events, unexpected economic data, pandemics, or natural disasters can trigger risk-off behavior. If these events do not materially alter long-term earnings prospects, the resulting market corrections are often temporary.
- Leverage and forced selling can amplify declines. When investors use margin, falling prices can trigger margin calls that force asset sales. This mechanical selling pressure can push prices below levels justified by fundamentals, intensifying volatility during corrections.
How to Respond
The most consistent guidance from long-term investment research is straightforward: stay invested and continue your plan. In practice, this means maintaining regular contributions and avoiding reactive decisions during corrections, bear markets, or even crashes.
This advice is simple in theory but difficult to execute. A 15% portfolio decline triggers powerful emotional responses. Headlines warn of further losses. Colleagues talk about moving to cash. In these moments, selling feels protective, even rational, despite the lack of evidence supporting that instinct.
Decades of market data show that investors who remained invested through downturns achieved materially better long-term outcomes than those who attempted to sidestep declines through market timing. Missing even a small number of recovery days has historically reduced total returns. As a result, investors have generally been better served by adding to portfolios during corrections rather than withdrawing from them.
Corrections also create structural advantages. Investors with available cash can deploy it at lower valuations. Those contributing regularly, such as through monthly retirement plans, automatically buy more shares at reduced prices. For disciplined rebalancers, declines allow capital to shift from assets that held up better into equities trading at temporary discounts.
The response to avoid is selling with vague plans to “get back in when things stabilize.” Markets recover before conditions feel comfortable. By the time stability is obvious, prices are typically higher, and much of the rebound has already occurred.
The Difference Between Knowing and Experiencing
Knowing intellectually that market corrections are normal is very different from experiencing one in real time. Reading about historical drawdowns does not prepare most investors for the emotional impact of watching a portfolio fall 15% in a matter of weeks. While the data says markets recover, fear often overrides logic when real money is at stake.
This gap between knowledge and emotion explains why investors repeatedly make poor timing decisions despite decades of evidence showing that market timing reduces long-term returns. During a first correction, many investors convince themselves that “this time is different.” They find seemingly rational reasons to sell, even though similar arguments have appeared in nearly every past decline and were later proven wrong.
Experienced investors have lived through multiple corrections. Many have felt the anxiety, acted emotionally early in their investing journey, and learned, often the hard way, that discipline matters more than prediction. Beginners lack this experiential reference point, which is why the first significant downturn is often the most psychologically challenging.
The goal is not to eliminate anxiety. Even seasoned investors feel discomfort during market declines. The key is preparation. A written investment plan that defines how you will respond to 10%, 15%, and 20% drawdowns removes decision-making from moments of stress. When a correction arrives, following a pre-committed plan is far more effective than reacting emotionally in real time.
Corrections Versus Bear Markets Versus Crashes
While the thresholds separating these categories are somewhat arbitrary, why does a 19.9% decline qualify as a correction while 20.1% becomes a bear market? their typical behavior differs in important ways. Corrections (declines of roughly 10%–20%) usually resolve within months and do not, on their own, signal serious economic deterioration. Bear markets (declines of 20% or more) often coincide with periods of economic stress or recession, tend to last longer, and require greater investor patience. Crashes, which involve sudden and severe declines over days or weeks, frequently trigger panic and policy responses but can reverse quickly if underlying fundamentals remain intact.
From an investor response perspective, however, these distinctions matter less than they appear. Whether markets are experiencing a correction, a bear market, or a crash, the historically effective approach remains the same: maintain your investment plan, continue regular contributions, avoid panic selling, and recognize that recoveries have followed declines over time, even when the timing was unpredictable.
The key insight is that normal market volatility includes declines that feel abnormal while you’re living through them. Ten percent corrections have occurred regularly throughout market history, often every one to two years. They are features of equity markets, not failures. Developing the ability to tolerate them without overreacting is a core long-term investing skill, more important than short-term tactics like seasonal trends or market timing signals.
Over an investing lifetime, your portfolio will experience many corrections. Some will align with weak seasonal periods; others will occur during traditionally strong months. Each will feel unsettling while it’s happening. Each has historically passed. Understanding this cycle helps investors maintain discipline and perspective across all market environments.
This article is part of Mooloo’s Market Cycles & Risk sub-hub, which explains how financial markets behave across economic cycles, stress events, and systemic uncertainty without relying on forecasts or timing narratives.