Is the Stock Market Really Seasonal? What Every New Investor Needs to Know

Market seasonality, the idea that stocks follow recurring calendar-based patterns like “Sell in May” or the “Santa Claus rally”, is real in historical data but unreliable as an investment strategy. Long-term records show certain months, such as November and December, have averaged stronger returns, while September has historically been weaker. However, these are descriptive averages, not predictive signals. Once seasonal patterns become widely known, their advantage tends to fade as markets adapt. For beginner investors, acting on seasonality often increases costs, taxes, and the risk of missing the market’s most important recovery days. The evidence consistently shows that staying invested and compounding over time matters far more than timing the calendar.
- Seasonal patterns exist but weaken over time: Academic research across global markets finds calendar effects, yet many, like the January Effect, have materially diminished in the post-1990 era as markets became more efficient.
- Late-year strength is common, not guaranteed: November and December have ranked among the stronger months for U.S. stocks on average since 1928, while September has been the weakest, according to long-run S&P 500 data.
- Timing the calendar hurts compounding: Missing just a handful of the market’s best days dramatically reduces long-term returns, a risk amplified by seasonal trading strategies.
- “Sell in May” has been costly over decades: Investors who exited each summer historically accumulated far less wealth than those who remained invested continuously, largely due to lost compounding.
- Best use of seasonality is perspective, not action: Recognizing that volatility often clusters in certain months can help investors stay disciplined, but it should never replace diversification, regular contributions, and a long-term plan.
For generations, Wall Street has whispered about market seasonality, the idea that stock returns follow recurring patterns tied to the calendar. From the old saying “Sell in May and go away” to the hopeful “Santa Claus rally,” these phrases persist in trading circles and investment commentary like financial folklore. But how much truth do they actually hold? For beginner investors, separating myth from measurable reality can be the difference between healthy perspective and costly overconfidence.
The honest answer lies in the middle. Yes, seasonal patterns do appear in historical market data. But no, their existence does not make them reliable tools for investment strategy. Patterns that show up over decades often weaken, disappear, or reverse once widely known, leaving investors exposed to false confidence rather than consistent results.
Understanding Market Seasonality
Market seasonality describes recurring tendencies in stock prices that align with certain times of the year. It is not superstition or astrology, but statistical patterns identified in long-term market data. These tendencies are commonly associated with behavioral and institutional factors such as earnings-reporting cycles, tax-calendar effects, portfolio rebalancing, bonus-related cash flows, and periods of lower trading activity during holidays and summer months.
Academic research has documented calendar-based effects in financial markets for more than a century. Large cross-market studies examining dozens of countries consistently find evidence of at least one form of seasonal or calendar anomaly in most equity markets. In several European markets, including the U.K. and the Netherlands, historical price records extend back hundreds of years, showing that seasonal tendencies existed well before modern trading systems.
While these effects have often appeared stronger in certain European markets, similar seasonal patterns have been observed across nearly all major developed economies. However, their strength has varied over time, and many have weakened as markets have become more efficient, reinforcing that seasonality reflects historical tendencies rather than reliable predictive signals.
The Monthly Performance Picture
When examined across long stretches of market history, patterns in monthly returns do become visible. Over multiple decades of S&P 500 data, November and December have consistently ranked among the stronger months on average, contributing to a broader late-year tendency often referred to as a year-end or holiday rally. While rankings vary slightly depending on the time frame used, the overall pattern of stronger performance toward the end of the year has appeared repeatedly in long-term datasets.
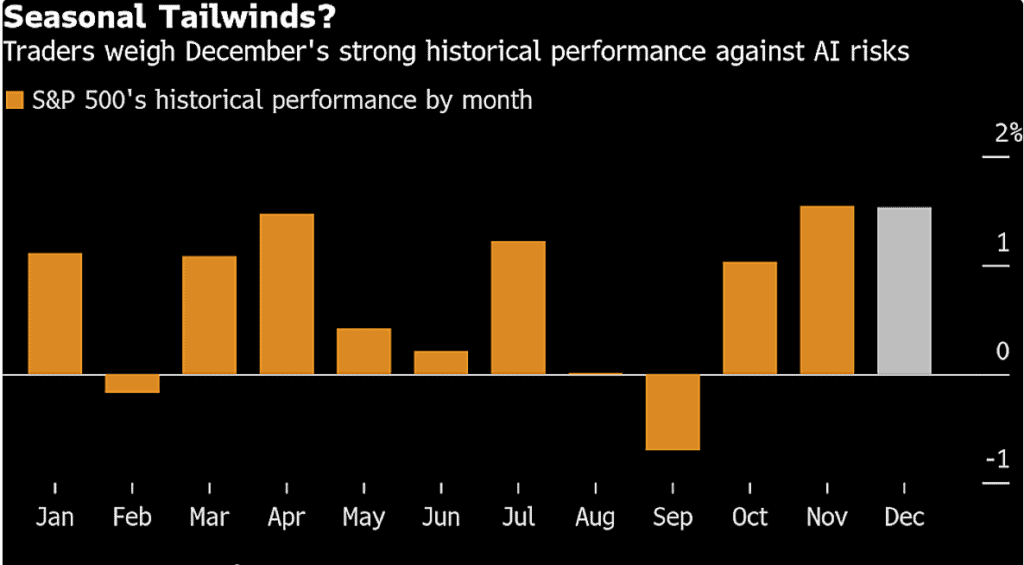
Source: Yahoo Finance
By contrast, September has historically been the weakest month for U.S. equities. Since 1928, the S&P 500 has posted a negative average return in September and declined more frequently than in any other calendar month, making it the only month with more losing years than winning ones over the full historical record. October has often followed periods of September weakness with improved performance, and by November, markets have frequently regained positive momentum.
Recent history provides a clear example. In November 2024, the S&P 500 gained roughly 5–6%, marking its strongest monthly advance of the year. The rally followed heightened political clarity after the U.S. election, resilient economic data, and growing confidence that inflation pressures were easing. While the specific catalysts behind late-year rallies differ from year to year, the broader seasonal rhythm has tended to repeat over time.
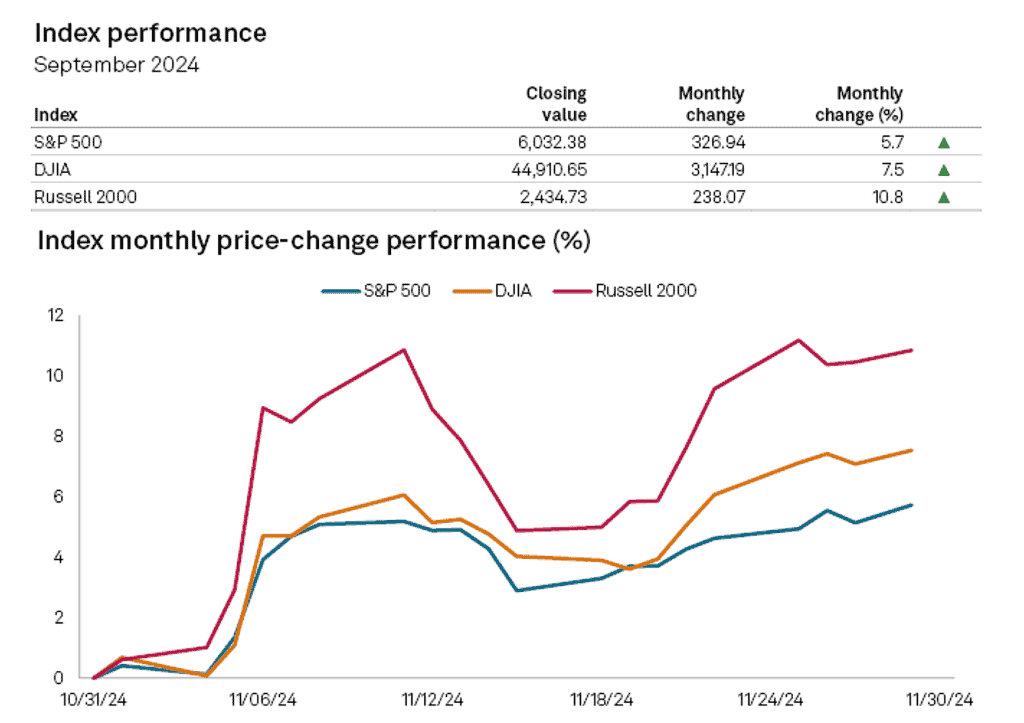
Source: S&P Global
Why Patterns Emerge
Recurring market behavior arises from a mix of psychology and institutional routine.
- Tax-season dynamics. Near year-end, investors often sell underperforming assets to offset capital gains. This can pressure prices in late November and December, with selling effects sometimes reversing in January.
- Portfolio “window dressing.” Some fund managers adjust holdings before reporting periods, emphasizing recent winners and trimming laggards. This behavior is most visible around quarter-ends, particularly in December, though its market impact varies.
- Cash-flow timing. Early in the year, new capital enters markets through retirement contributions, bonus reinvestment, and allocation resets. These inflows can support demand but do not guarantee higher returns.
- Summer slowdown. Trading activity often declines from June through August as institutional participation eases. Lower liquidity can magnify short-term price movements during this period.
- Earnings calendar. Earnings seasons create recurring spikes in trading and volatility. With reports clustered in January–February, April–May, July–August, and October–November, these cycles influence sentiment throughout the year.
Together, these factors create recognizable, but imperfect, seasonal tendencies rooted in collective behavior rather than predictable market rules.
The Critical Distinction
Here’s what novice investors must keep clear: seeing a pattern does not make it predictive. Historical average returns describe what has happened, never what will happen next. Markets change, data evolves, and past averages cannot forecast specific future moves.
The January Effect is a classic example. Early academic research from the 1970s and 1980s documented that stocks, especially small-capitalization stocks, often outperformed during January. At the time, multiple peer-reviewed papers showed statistically significant excess returns concentrated in the first month of the year.
However, newer long-horizon analyses show the effect has materially weakened. Using modern datasets covering the post-1990 period, January no longer consistently ranks as the strongest month for U.S. equities. From the mid-1990s through the mid-2020s, January produced positive S&P 500 returns in roughly 55–60% of years, only modestly better than a coin flip, and ranked as the single best-performing month in only a small minority of years. These results contrast sharply with the dominance observed in earlier decades.
Economists commonly point to the efficient market hypothesis as the explanation. Once a seasonal edge becomes widely known, market participants attempt to exploit it, increasing competition and arbitrage activity. Over time, this process reduces or eliminates the excess return. Seasonal anomalies tend to fade not because they were imaginary, but because markets adapt as behavior changes.
The Real Cost of Seasonal Strategies
For investors tempted to act on seasonal patterns, the math rarely favors short-term moves. Frequent buying and selling amplifies transaction costs and tax drag. More damaging still, market timing increases the risk of missing the strongest recovery days, the small number of trading sessions that drive a disproportionate share of long-term market returns.
Long-horizon market data consistently show that remaining fully invested produces far stronger outcomes than attempting to step in and out. Between 2004 and 2024, an investor who stayed invested in the S&P 500 achieved nearly double the cumulative return of one who missed just 10 of the index’s best-performing days. Importantly, many of those powerful gain days occurred immediately after sharp market declines, precisely when seasonal or defensive traders are most likely to be sidelined.
Stretch the timeline further and the cost grows severe. Historical return data indicate that $1,000 invested continuously in the S&P 500 in 1975 would have grown to more than $300,000 by late 2024, driven by uninterrupted compounding. By contrast, an investor who exited the market each year at the end of April and re-entered in November, following the traditional “Sell in May” strategy, would have accumulated closer to $60,000, representing roughly an 80% reduction in cumulative wealth relative to staying invested.
The lesson is consistent across decades: seasonal strategies don’t fail because markets lack patterns, but because missing a small number of critical days overwhelms any potential seasonal edge, permanently undermining long-term compounding.
What Beginner Investors Should Do
Acknowledging that seasonal patterns exist doesn’t mean using them as a guide. For most investors, particularly those focused on decades of wealth building, the rational path remains consistent: maintain a well-diversified portfolio aligned with your goals, contribute regularly, and resist short-term impulses tied to the calendar.
That said, understanding seasonality can improve perspective. When September volatility appears, it helps to recognize that temporary weakness has frequently aligned with historical patterns and does not, by itself, justify panic selling. When strong November rallies boost optimism, it’s worth remembering that such moves have precedent and do not necessarily signal superior market insight.
A useful analogy is climate versus weather. Long-term climate data tells us July is warmer than January, yet daily temperatures still vary widely. You wouldn’t plan next week’s outfit based on a long-term average. In the same way, historical monthly returns provide context, not certainty. The goal is preparedness for variability, not precision forecasting.
Over long horizons, the market’s record is remarkably consistent. Since 1928, U.S. stocks have produced positive returns in roughly three-quarters of calendar years. Short-term fluctuations, including seasonal dips, fade in significance when viewed across multiple decades.
For beginner investors, the sustainable advantage comes not from timing seasonal highs and lows but from riding the market’s long-term upward trajectory, starting early, staying invested, and maintaining discipline through every season.
Market seasonality is real and well documented, but for most investors it remains more an academic observation than an actionable strategy. The calendar may shape expectations, but lasting wealth depends on time in the market, not timing the market.
About this topic
This article forms part of Mooloo’s investing education series, which explains how markets work, how risk and returns are generated, and how investors can make better long-term decisions.
Learn more in our How Investing Works guide.