The Uber vs Lyft Earnings Gap That’s Costing Drivers Thousands

For U.S. rideshare drivers, choosing between Uber and Lyft can mean thousands of dollars in annual income differences. Recent data shows Uber drivers consistently earn more per week than Lyft drivers, largely due to higher demand, surge pricing opportunities, and reduced downtime. Understanding the real gap after expenses helps drivers make smarter platform choices in 2025.
- Weekly Earnings Gap: Uber drivers averaged about $513 per week in 2025, compared to Lyft drivers’ $318 in 2024, a nearly $200 difference that compounds into thousands annually.
- Engaged vs. Idle Time: Both companies report >$30/hour during trips, but unpaid waiting time disproportionately impacts Lyft drivers, lowering effective pay.
- Bonuses & Surge: Uber’s surge pricing is more frequent and profitable than Lyft’s “Prime Time,” creating additional income opportunities.
- Trip Mix: Uber secures more long airport and high-demand rides, while Lyft drivers often get shorter urban trips that increase downtime and costs.
- Driver Strategies: Using both apps, tracking true net income with tools like Gridwise, and focusing on peak demand zones can help close the gap.
For rideshare drivers, every dollar of income makes a difference. Deciding whether to drive for Uber or Lyft isn’t just about convenience, it can change annual earnings by thousands of dollars. The pay gap between the two platforms has been documented through company disclosures, independent driver studies, and extensive data analysis. Understanding how and why this gap exists helps drivers make informed choices about where to invest their time and mileage.
What the Data Shows About Uber vs Lyft Pay
Lyft’s Reported Driver Earnings
Lyft has stated that in late 2023, the median U.S. driver earned $30.68 per engaged hour, that is, time spent with a passenger in the car or driving to pick one up. After subtracting operating costs such as gas, insurance, and vehicle maintenance, Lyft estimated net earnings of $23.46 per engaged hour. However, these figures do not reflect downtime when drivers are waiting for requests. In 2024, Lyft’s average weekly earnings fell to about $318, partially because drivers reported working fewer hours compared to prior years.
Uber’s Reported Driver Earnings
Uber claims drivers earn above $30 per engaged hour while on a trip, though like Lyft’s numbers, this excludes waiting time and expenses. A 2025 Gridwise analysis found Uber drivers made about $513 per week, with slightly higher hours than in 2023. As mentioned, Lyft drivers averaged $318 per week in 2024, partly due to fewer hours worked. This nearly $200 weekly gap compounds into thousands of dollars annually.
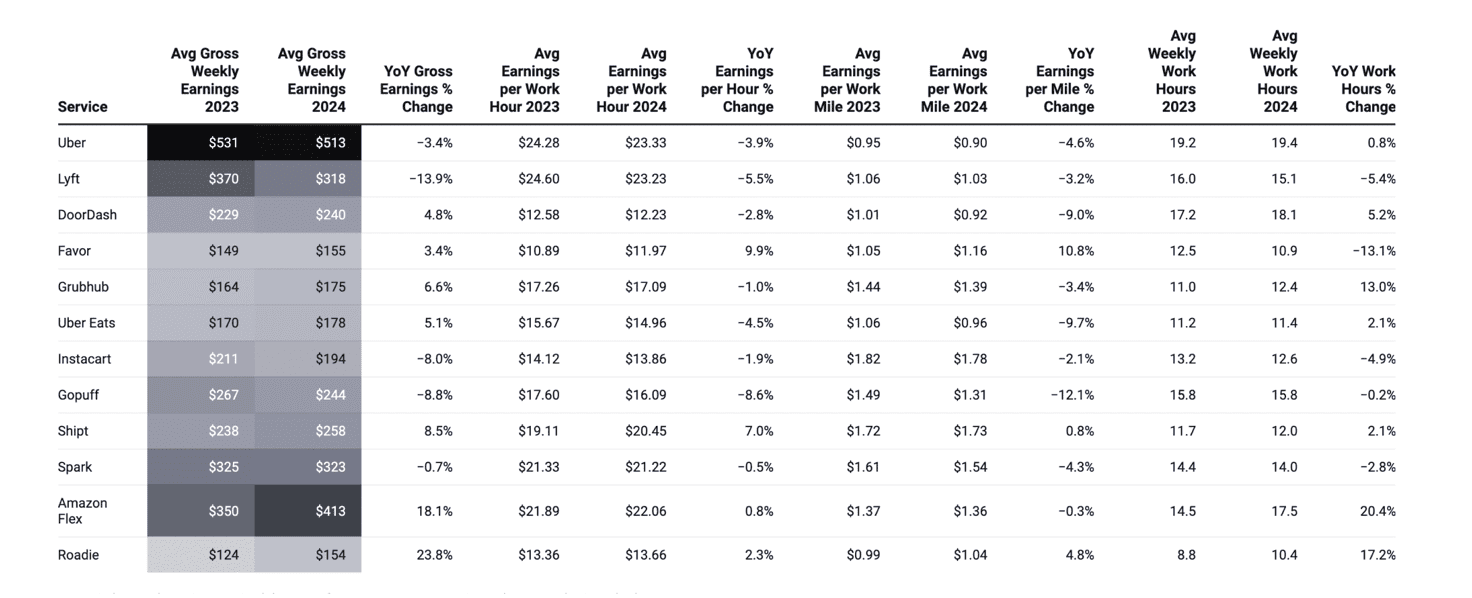
Source: Gridwise
Why the Earnings Gap Exists
Engaged vs. Non-Engaged Time
One of the biggest drivers of the pay gap is unpaid downtime. Drivers are only paid for “engaged” time, so every minute spent waiting in low-demand areas reduces their effective hourly wage. If Lyft drivers experience more downtime than Uber drivers, even similar engaged-hour pay rates can lead to very different take-home amounts.
Bonuses and Surge Pricing
Uber’s surge pricing model has become a cornerstone of its earnings system, offering drivers higher fares during peak demand. Lyft offers “Prime Time” bonuses, but drivers consistently report that Uber’s surge opportunities tend to be more frequent and lucrative. The difference in bonus structures can account for a significant portion of the weekly income gap.
Ride Mix and Passenger Demand
Uber’s market share and broader global presence give it a natural advantage in attracting longer, higher-paying trips such as airport rides. Lyft, in contrast, often sees more short-distance urban trips. While short trips can add up, they also reduce opportunities for surge pricing and increase time spent repositioning, which eats into profitability.
Driver Costs
Regardless of platform, drivers face the same fixed costs: gas, insurance, depreciation, and maintenance. For drivers with less fuel-efficient vehicles, small differences in gross pay can quickly vanish. For example, a 15-mile airport trip that looks profitable on Uber could yield less after accounting for fuel, while if Lyft drivers are forced into multiple short trips that will increase wear and tear.
How Much the Gap Costs in Real Dollars
A difference of just a few dollars per hour adds up over the course of a year. Consider these scenarios:
-
A $5 hourly difference, working 20 hours per week for 50 weeks, equals $5,000 annually.
-
The same $5 gap at 40 hours per week means $10,000 annually.
-
At a $7 hourly gap, driving 30 hours per week, the annual difference grows to $10,500.
This means that over time, choosing the lower-paying platform without careful strategy could cost a driver the equivalent of a year’s worth of car payments or even tuition at a community college.
What Drivers Can Do to Close the Gap
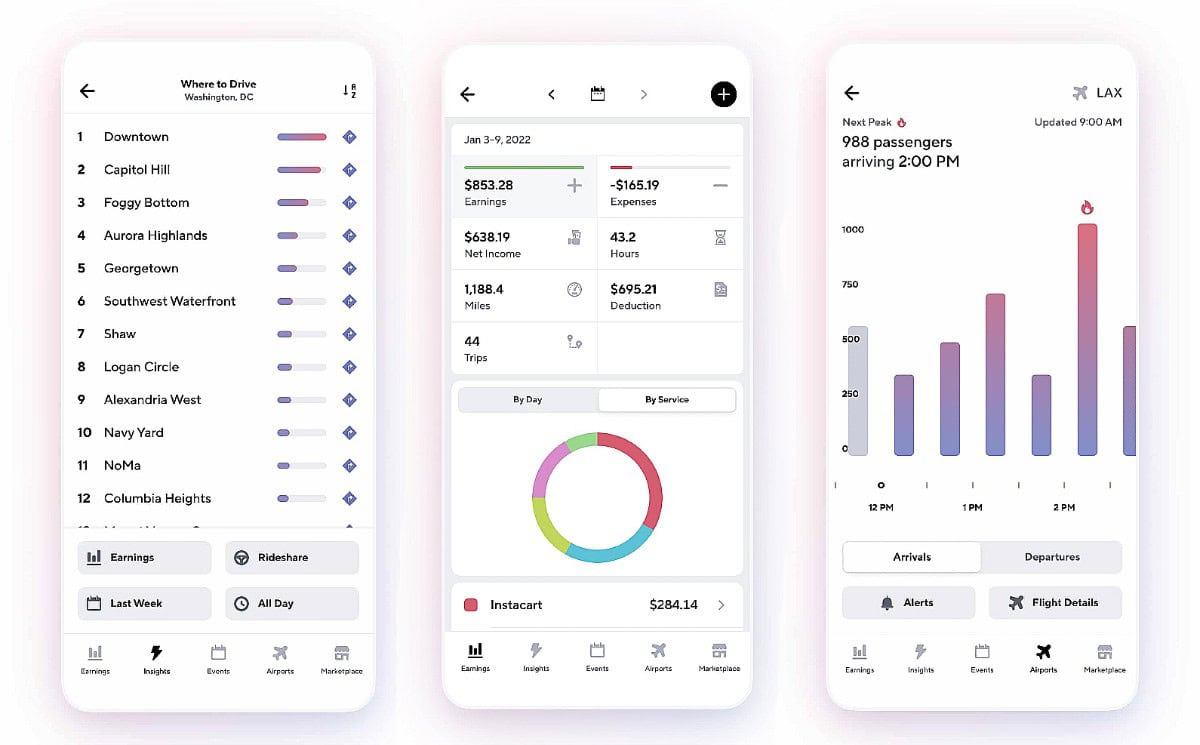
Tools like Gridwise provide info like the best places to find a fare, budgeting apps – and even flight passenger information. Source: Gridwise
Drivers are not powerless in the face of these discrepancies. Several strategies can help maximize net income:
-
Multi-Platform Driving: Running both apps simultaneously allows drivers to compare ride offers in real time, ensuring they accept only the best-paying trips.
-
Tracking Net Income: Tools such as Gridwise and MileIQ help drivers log expenses, track downtime, and calculate true net income, not just gross fares.
-
Driving Smarter, Not Longer: Strategically focusing on peak demand zones, rush hours, and airport runs can significantly raise effective hourly pay without requiring extra hours behind the wheel.
Conclusion
The Uber vs Lyft earnings gap is significant and well-documented, with Uber drivers often taking home hundreds more per week than their Lyft counterparts. Over a year, this difference can amount to five figures in lost income. While results vary based on city, driver hours, and vehicle type, the data shows that strategic drivers who monitor expenses, leverage both platforms, and maximize surge pricing opportunities can substantially improve their bottom line.