The New Hiring Math: Revenue-Per-Employee Benchmarks Across Industries

In 2025, revenue per employee has become one of the clearest indicators of whether an early-stage startup is scaling sustainably or adding complexity faster than output. With capital more selective and profitability expectations higher, this metric shows how much economic value each hire must generate to support growth without accelerating burn. For B2B SaaS companies, medians now cluster around $130,000 per employee, but “good” performance varies sharply by stage, funding model, and industry. Founders who treat revenue per employee as a forward-looking hiring constraint, not just a retrospective KPI, are better positioned to reach breakeven on lower revenue and withstand market slowdowns.
- 2025 benchmarks: Early-stage SaaS companies under $1M ARR typically generate ~$60k–$80k per employee, rising to ~$110k–$140k in the $1–5M ARR range, with top performers reaching ~$180k–$200k as go-to-market becomes repeatable.
- Bootstrapped vs. venture-backed: Bootstrapped startups usually show 20–30% higher revenue per employee at the same ARR because hiring is constrained by cash flow, while venture-backed teams hire ahead of revenue to optimize for speed.
- Hiring math matters: Each new hire should be justified by the incremental revenue they can enable within 3–6 months; otherwise, revenue per employee declines and efficiency erodes.
- AI raises the bar: Teams deeply integrated with AI and automation can reasonably target 20–30% higher revenue per employee than 2023-era benchmarks at the same stage.
- Context is critical: Healthy ranges differ widely by industry and model, what’s efficient for SaaS may be unrealistic for hardware or services, so comparisons must be stage- and peer-specific.
In 2025, one of the most important efficiency metrics for early-stage founders isn’t total revenue or headline growth, it’s revenue per employee. As capital becomes more selective and profitability expectations rise, this metric has emerged as a practical way to measure whether a startup is scaling efficiently or adding complexity faster than output.
Revenue per employee helps founders understand how much economic value each hire must generate to sustain growth without accelerating burn. In the current market, where investors prioritize capital discipline and clear paths to breakeven, startups that ignore this math risk becoming overstaffed and fragile. Those that get it right build lean organizations capable of reaching profitability on lower revenue and weathering market slowdowns.
The 2025 Benchmarks
In 2025, the median revenue per employee for private B2B SaaS companies stands at approximately $130,000, up modestly from around $125,000 the prior year. This metric has remained relatively stable, reflecting a continued industry focus on efficiency rather than headcount-driven growth. However, this headline number masks significant variation by company stage, revenue scale, and operating model.
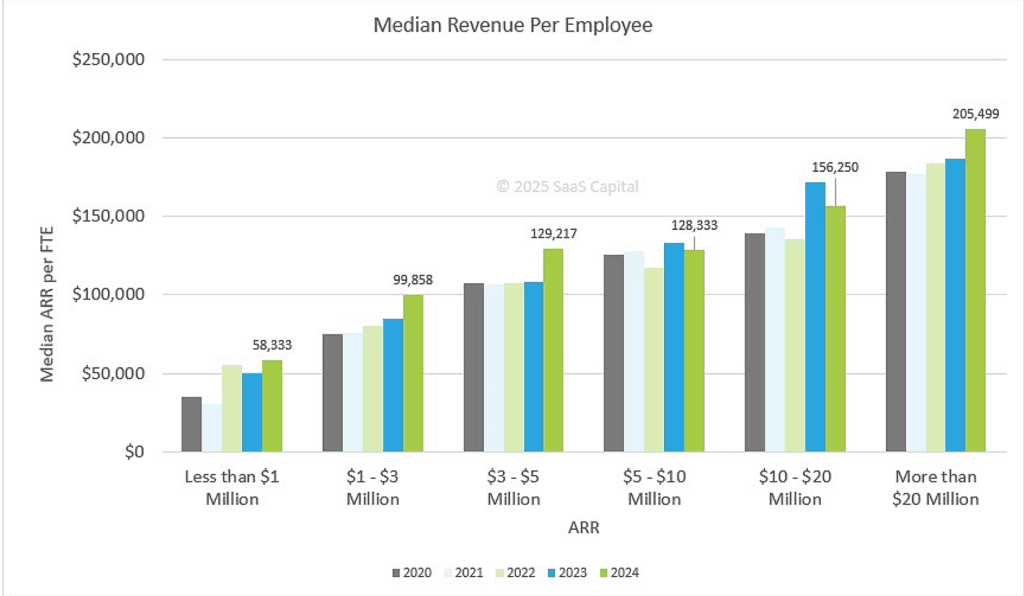
Source: Saas Capital
For early-stage companies with annual recurring revenue below $1 million, revenue per employee is materially lower. Benchmark data from private SaaS surveys shows medians typically in the $60,000–$80,000 range, reflecting the reality that small teams are still building product, establishing go-to-market motion, and carrying engineering and operational overhead ahead of revenue scale.
As companies grow into the $1–5 million ARR range, revenue per employee rises meaningfully. Median performance in this bracket clusters around $110,000–$140,000 per employee, with top-quartile operators reaching $180,000–$200,000, driven by more repeatable sales processes and improved capacity utilization.
By the time companies reach $10–20 million in ARR, revenue per employee typically exceeds $150,000, and the most efficient organizations approach or surpass $200,000 per employee, reflecting mature go-to-market systems, tighter cost control, and operating leverage.
Why the Math Has Changed
Two forces are reshaping these benchmarks. First, AI and automation have raised output per employee, particularly in software. Claims that average revenue per employee across all industries reached $350,000 in 2024 are not consistently supported economy-wide, but software companies did see clear efficiency gains through 2023–2024. For top performers, year-over-year increases in the high-teens to mid-20% range are plausible. The move from $228,000 to $290,000 should be viewed as directional and cohort-specific, not universal.
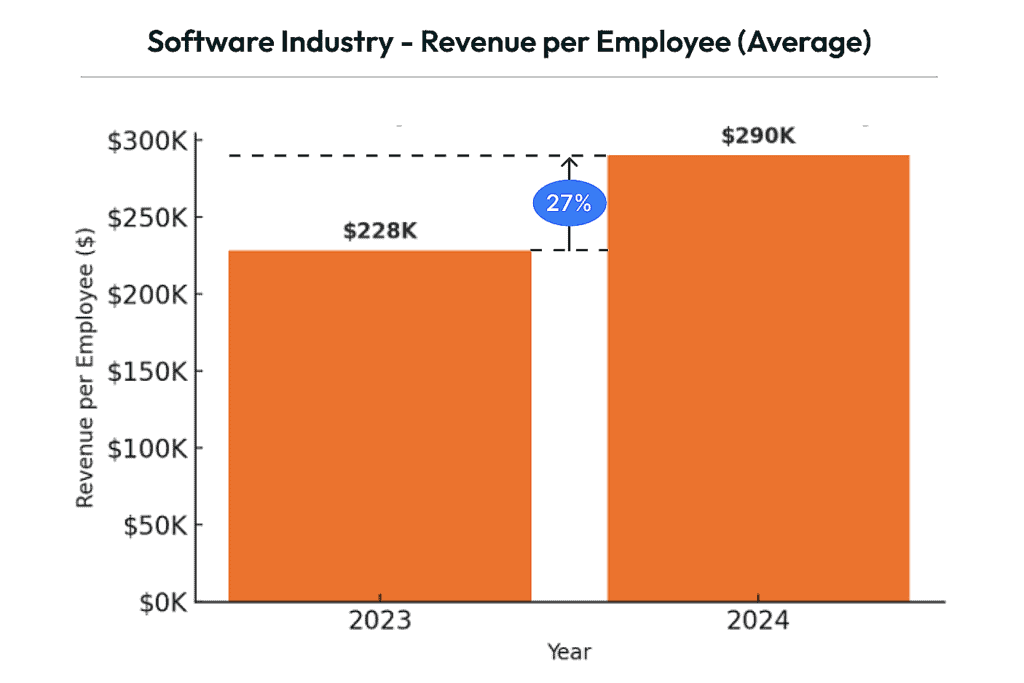
Source: CompanySights
Second, tighter capital markets have enforced discipline. Data tracked by Standard Metrics shows revenue per full-time employee improving through 2024 among late-stage startups, with the strongest gains in the top quartile. At $100M+ in annualized revenue, growth increasingly comes from operating leverage rather than headcount growth.
Benchmarks vary sharply by industry. Energy and utilities can generate several million dollars per employee. Among tech leaders, NVIDIA and Netflix operate at multi-million-dollar revenue per employee levels, while labor-intensive retailers sit far lower. Walmart generates roughly $300,000–$350,000 per employee.
The takeaway is simple: the math has changed, but unevenly. AI amplifies productivity where work is scalable, and capital pressure has made efficiency unavoidable.
The Stage-Specific Targets
Understanding what “good” looks like requires context around both company stage and funding model. For bootstrapped SaaS companies in the $1–3 million ARR range, revenue per employee is typically higher than that of venture-backed peers at the same stage, reflecting leaner teams and stricter hiring discipline. Across multiple SaaS benchmark reports, bootstrapped companies consistently show stronger early-stage efficiency because headcount growth is tightly constrained by cash flow rather than growth expectations.
Venture-backed companies at similar revenue levels generally report materially lower revenue per employee, often 30% or more below bootstrapped peers, because they hire ahead of revenue. Capital allows these teams to build sales, engineering, and operational capacity in anticipation of future scale, which depresses efficiency metrics in the short term.
This gap is structural rather than executional. Bootstrapped companies must justify every hire against current revenue, forcing higher utilization per employee. Venture-backed companies optimize for speed, market capture, and organizational readiness, accepting lower efficiency early in exchange for faster scaling potential.
As companies mature, the relationship shifts. By the time businesses reach $10–50 million in annual revenue, venture-backed companies often close the efficiency gap and may meet or exceed bootstrapped peers in revenue per employee, as earlier capacity investments begin translating into scale, repeatable sales motion, and operating leverage.
The Hiring Implications
These benchmarks have direct implications for when and how you hire. If you’re at $2 million in ARR with 20 employees, you’re generating $100,000 per employee, which falls within the commonly cited median range for bootstrapped SaaS companies at the $1–3 million ARR stage (roughly $90,000–$120,000 per employee, depending on cost structure and role mix).
Adding a 21st employee immediately changes the math. To simply maintain your current efficiency, ARR must rise to $2.1 million. To improve revenue per employee, you realistically need $2.2–$2.3 million, reflecting the fact that most new hires take 3–6 months to reach full productivity and rarely contribute incremental revenue immediately.
This creates a clear decision framework. Before making any hire, calculate: What revenue increase will this person enable, and how quickly? A salesperson capable of closing $400,000–$600,000 in new ARR annually can justify an all-in cost of roughly $140,000–$170,000, even after accounting for ramp time. An operations hire may justify a similar cost indirectly by freeing founder time to close deals, but only if that freed time reliably converts into revenue.
A hire who simply maintains the status quo increases headcount without increasing output, pushing revenue per employee lower and weakening overall efficiency.
Recent startup hiring data indicates that technical roles, especially engineering and AI-related positions, are among the most actively recruited functions in 2025, reflecting demand for product and technology expertise. Simultaneously, many startups are increasingly relying on automation tools and external HR/operations platforms to streamline internal support functions rather than substantially growing those teams.
The Function-Specific Math
Not every role generates revenue directly, but every role should contribute to revenue efficiency. Engineering in a product company is typically non-revenue-generating until the product ships and sells, but it is essential overhead. Customer success doesn’t usually close new deals, but it reduces churn and expansion risk, directly protecting and growing the revenue base.
The key is understanding unit economics by function rather than treating headcount as a flat cost. For SaaS companies, a commonly observed early-to-mid-stage allocation looks roughly like this:
-
Engineering: 25–35% of the team (product development and maintenance)
-
Sales: 15–25% (customer acquisition)
-
Customer success/support: 10–20% (retention, renewals, expansion)
-
Operations/admin: 10–15% (finance, HR, internal systems)
-
Marketing: 10–20% (pipeline and demand generation)
Early-stage companies typically skew more heavily toward engineering, often 40% or more, because product development precedes revenue scale. As companies grow, sales and customer success headcount expands to support acquisition and retention.
The proportions matter less than output. A five-person engineering team whose work supports $5 million in annual revenue is efficient. A twenty-person engineering team supporting the same revenue level is not. Efficiency is determined by revenue leverage per function, not by headcount alone.
The AI Multiplier Effect
The revenue-per-employee conversation has shifted materially with the broader adoption of automation and AI-assisted workflows. Verified benchmark data and enterprise research show that revenue per full-time employee improved across many late-stage companies through 2024, with top-quartile performers posting the strongest gains. While these improvements cannot be attributed to AI alone, increased automation, tooling consolidation, and AI-supported execution are widely cited contributors to rising operational efficiency.
This shift creates a new strategic calculation for founders. As modern tools reduce manual workload and increase execution capacity, companies must decide whether to translate those gains into higher revenue per employee or to limit incremental headcount growth while maintaining output. In practice, many high-performing organizations have focused on increasing output per employee rather than aggressive workforce reduction, using automation and AI to scale capacity without proportional team expansion.
For founders, this means 2025 hiring benchmarks should not simply replicate 2023 assumptions. If the median revenue per employee for bootstrapped companies at a given stage is approximately $100,000, teams that are meaningfully integrated with automation and AI tools can reasonably target higher efficiency levels over time. This reflects observed efficiency trends in AI-exposed organizations rather than an unusually aggressive or speculative performance target.
Industry Context Matters
While SaaS benchmarks are widely discussed, industry context is critical when interpreting revenue-per-employee. Broad cross-industry analyses commonly place a “healthy” range for many modern businesses in the roughly $200,000–$500,000 per employee band, but that headline range masks large structural differences by business model.
Hardware companies typically post lower revenue per employee because physical products require manufacturing, supply chains, logistics, and inventory, activities that add headcount without immediately scaling revenue. Services businesses also trend lower because they are labor-intensive by design; revenue scales more closely with billable hours. By contrast, marketplace models can show very high revenue per employee since transaction volume can increase dramatically without linear headcount growth.
The takeaway is comparison discipline. A hardware startup at $150,000 per employee can be performing well relative to peers, while a software company at the same level may be inefficient. Evaluating performance against industry-specific norms, not generic SaaS targets, prevents misleading conclusions.
The Warning Signs
Three red flags should trigger immediate attention. First, if revenue per employee is declining as the company grows, it usually indicates hiring is outpacing revenue growth. This pattern is well documented in startup benchmarks and often stems from confusing visible activity with real progress, adding people increases costs immediately, while revenue lags.
Second, if you are materially below the median for your stage and funding model, you likely have a revenue efficiency problem, a headcount allocation problem, or both. The fix is not automatically layoffs. In many cases, teams are misallocated toward experimentation or internal projects instead of activities that directly drive or protect revenue.
Third, when top-quartile peers operate at 2–3× higher revenue per employee, the gap is rarely randomness. It typically reflects stronger operational discipline, tighter prioritization, better tooling and automation, or clearer accountability, advantages that compound over time if left unaddressed.
Building Toward Efficiency
Well-run companies increasingly treat revenue per employee as a planning constraint, not merely a retrospective metric. Before adding headcount, founders assess whether a role is likely to increase output per employee, either through direct revenue generation, measurable cost leverage, or by enabling existing teams to operate more efficiently.
This discipline is closely associated with stronger unit economics. As companies approach profitability, revenue-per-employee figures often improve, largely because hiring slows relative to revenue growth and operational focus tightens. The gains come from execution and cost control rather than expansion alone.
Revenue per employee should be tracked as a dynamic operating benchmark. Reviewing it monthly, comparing it against stage- and model-appropriate ranges, and incorporating it into hiring decisions helps prevent headcount growth from outpacing economic reality.
In 2025, long-term resilience is less about growing teams quickly and more about scaling output efficiently. Companies that align hiring with productivity gains are better positioned to sustain growth with fewer structural risks.