How Insurance Pricing Actually Works: The Mathematics Behind Your Premium

Insurance pricing isn’t arbitrary, it’s a structured calculation built on risk pooling, actuarial modeling, operating costs, and required capital. While insurers don’t disclose their exact algorithms, understanding the mechanics behind premiums can help you evaluate whether a quote reasonably reflects your risk, spot mispricing, and make smarter coverage decisions in 2024–2025 market conditions.
- Premiums start with expected claims costs: Actuaries estimate the “pure premium” based on historical losses within similar risk groups, then layer in expenses (often ~25–30%) and capital charges to ensure solvency.
- Risk pooling keeps insurance affordable, but imperfect: The law of large numbers stabilizes pricing, while adverse selection pushes premiums higher when riskier policyholders dominate a pool.
- The combined ratio reveals pricing discipline: A ratio below 100% signals underwriting profit; in 2024, U.S. property and casualty insurers averaged about 96.9%, reflecting improved pricing after prior loss years.
- Your individual factors still matter: Location, claims history, property or vehicle traits, and, where permitted, credit-based insurance scores materially affect pricing, especially as catastrophe and theft risks rise.
- Pricing is dynamic, not static: Rate increases, tighter underwriting, telematics, and data-driven models are reshaping premiums as insurers respond to inflation, catastrophe losses, and emerging risks like cyber threats.
Insurance pricing often feels like a black box. You provide personal and property information, and a premium is generated using proprietary actuarial models and rating algorithms approved by regulators. While consumers rarely see how individual factors are weighted, understanding the mechanics behind pricing can help you make smarter coverage decisions and better recognize when a quote is competitive or misaligned with your risk profile.
The Foundation: Risk Pools and the Law of Large Numbers
At its core, insurance operates on a simple economic principle: the many share the financial cost of losses experienced by the few. When you pay an insurance premium, your money joins a pool with thousands or millions of other policyholders. This collective fund is used to pay claims as they arise.
The system depends on effective risk pooling to function. A well-balanced pool spreads risk across participants so that high-cost claims are offset by lower-risk members, keeping premiums stable and predictable. As the pool grows larger and more diverse, outcomes become more predictable due to the law of large numbers. However, if too many higher-risk individuals enter the same pool, premiums rise for everyone. This dynamic, known as adverse selection, can trigger a feedback loop in which lower-risk participants exit, leaving behind a riskier and increasingly expensive pool.
Consider a simple example: if 100 people each contribute $1,000, the pool contains $100,000. If expected claims total $80,000 and operating costs are $15,000, the pricing is sustainable. But if the pool attracts disproportionately high-risk members and claims rise to $120,000, premiums must increase or the insurer will incur losses.
The Actuarial Calculation: More Than Just Math
Insurance companies employ actuaries, professionals trained in statistics, probability, and financial theory, to analyze risk and uncertainty. These specialists build pricing models using multiple approved rating factors, such as age, location, claims history, vehicle or property characteristics, and, where legally permitted, credit-based insurance scores.
The actuarial pricing process has evolved significantly in recent years. Insurers increasingly rely on predictive modeling and machine-learning techniques to improve risk classification and loss forecasting. These models analyze large historical datasets and are updated periodically to reflect emerging trends, rather than recalculating base premiums in real time for each individual policy.
The basic premium calculation generally includes several components:
- Pure premium represents the expected cost of claims. If historical data show that drivers within a defined risk group generate an average of $800 per year in covered losses, that amount forms the loss-cost foundation of the premium.
- Operating expenses cover costs such as claims administration, agent commissions, marketing, technology, and regulatory compliance. In property and casualty insurance, expense ratios commonly fall in the range of roughly 25–30%, though they vary by insurer and line of business.
- Profit and risk charges provide compensation for the capital insurers must hold to remain solvent during adverse loss years. These charges account for uncertainty, catastrophic risk, and regulatory capital requirements, ensuring the insurer can meet claim obligations even when losses exceed expectations.
The Combined Ratio: Insurance’s Report Card
To understand whether an insurer is pricing correctly, look at the combined ratio, a key metric that measures underwriting profitability. A combined ratio below 100 percent indicates an underwriting profit, meaning the insurer collected more in premiums than it paid in claims and operating expenses.
In 2024, the U.S. property and casualty insurance industry achieved a combined ratio of 96.9%, marking strong underwriting performance. For context, the industry’s 2024 results mark the 10th net underwriting profit in the last 20 calendar years.
Different lines of business show vastly different profitability: workers’ compensation has maintained historically favorable ratios around 88.8%, while commercial auto liability struggled with ratios above 113%.

Source: NAIC
When the combined ratio exceeds 100%, insurers lose money on underwriting but may still be profitable overall thanks to investment income from premiums held before claims are paid.
What Actually Drives Your Individual Premium
While pool dynamics determine baseline pricing, your individual premium reflects personal risk factors. In health insurance, retail prescription drug spending rose 11.4% in 2023 and has been one of the faster-growing categories of health spending in recent years. For 2025, employer-plan premiums are rising, and large employers are expanding coverage for GLP-1 weight-loss drugs, which can add meaningful cost pressure depending on plan design and utilization.
Geographic location plays an enormous role. Living in a flood-prone area or a region with high auto theft rates directly increases your premium. Catastrophe costs are increasingly embedded into pricing assumptions, but they’re not a single standardized “surcharge” across the industry. AM Best previously projected a 6.8-point catastrophe load for 2024, and later reported that catastrophe losses added an estimated 8.7 points to the 2024 combined ratio.
Your personal characteristics matter too, but not always in obvious ways. Insurers use sophisticated models that may consider your occupation, education level, homeownership status, and credit-based insurance scores depending on the insurance type and state regulations. These factors are used where permitted because they correlate with historical claim frequency and severity, even if the connection isn’t immediately intuitive.
The Dynamic Nature of Insurance Pricing
Premiums are not static. Insurers regularly adjust pricing in response to emerging loss data, regulatory changes, and broader market conditions. After several years of underwriting losses in personal auto insurance, when the combined ratio rose above 110% and reached roughly 112% in 2022, results improved meaningfully by 2024. Estimates for the 2024 U.S. private passenger auto combined ratio fall in the mid- to high-90% range, reflecting a return to underwriting profitability as cumulative rate increases and tighter underwriting standards began to offset elevated repair costs and loss severity.
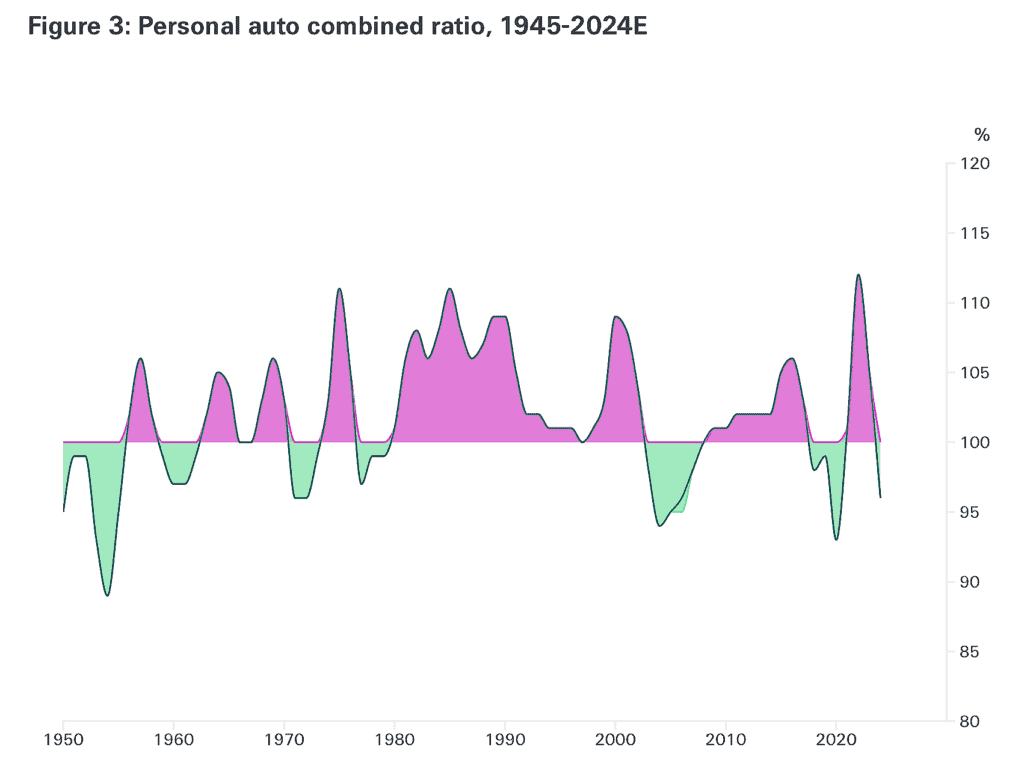
Source: Swiss Re
At the same time, insurers are increasingly using advanced analytics to refine pricing and risk assessment. Usage-based insurance programs rely on telematics to measure driving behavior such as mileage, braking, and time of day, allowing premiums to better align with observed risk rather than relying solely on traditional demographic proxies.
In cyber insurance, carriers are expanding the use of data-driven models and automated analytics to support underwriting, pricing, and claims handling, helping them respond more quickly to evolving threats such as ransomware, though adoption and sophistication vary widely across the market.
Understanding the Trade-offs
The tension in insurance pricing ultimately comes down to balancing affordability against actuarial fairness. If premiums perfectly reflected individual risk, some policyholders would be priced out of coverage altogether. Risk pooling provides a broader social benefit by spreading costs across many participants, but excessive pooling means lower-risk individuals inevitably subsidize higher-risk ones.
The most important thing to understand is that your premium is not arbitrary. It reflects a structured calculation based on expected claims costs, the insurer’s operating expenses, required capital and reserves, and the cost of protecting against catastrophic losses. When insurers price too low, underwriting losses eventually force sharp premium increases. When they price too high, competitive pressures push customers toward cheaper alternatives.
The system is imperfect, but understanding these mechanics puts you in a stronger position to evaluate whether the price you’re paying reasonably reflects the protection you’re receiving.