September Slump: Why the Stock Market’s Weakest Month Matters Less Than You Think

The so-called September Effect refers to a long-running historical pattern in which U.S. stocks, on average, have delivered their weakest returns during September. Since continuous S&P 500 data began in 1928, September has posted the lowest average monthly performance and the highest frequency of declines. However, this pattern reflects a statistical tendency, not a reliable investment signal. Outcomes vary widely year to year, and attempts to time portfolios around September often create more risk, taxes, and missed upside than benefit. For long-term investors, September’s weakness is best viewed as context for volatility, not a reason to change strategy.
- Historically weak but inconsistent: Since 1928, the S&P 500 has averaged roughly a -1.1% to -1.2% return in September, yet the market still finishes the month higher in about 44% of years.
- Outliers drive the averages: A small number of extreme Septembers, such as 1931, 2008, and 2022, account for much of the long-term weakness.
- Structural explanations exist, but none are decisive: Factors like institutional rebalancing, fiscal-year timing, bond issuance, and investor psychology may contribute, yet no single cause explains September reliably.
- Market timing costs usually outweigh benefits: Avoiding September can trigger taxes, trading costs, and opportunity losses that exceed the month’s modest average decline.
- Long-term trends dominate: With U.S. stocks delivering roughly 10% annual returns over decades, one weak month is a footnote, not a roadmap.
Every year as summer wanes and autumn approaches, financial media outlets revisit warnings about September. Headlines often reference the “September Effect,” a well-documented seasonal pattern showing that, on average, U.S. stocks have delivered weaker returns in September than in any other calendar month. In long-term S&P 500 data, September has frequently posted the lowest average performance, giving the month a reputation for heightened volatility and downside risk.
The historical record behind this perception spans many decades, commonly beginning in 1928 with the creation of continuous S&P market data. For beginner investors, however, the crucial distinction lies between recognizing a statistical tendency and drawing practical conclusions from it. While September has underperformed on average, outcomes vary widely from year to year, and the presence of a long-term seasonal pattern does not automatically translate into reliable or actionable investment decisions.
The Historical Record
September’s reputation as the market’s problem child is grounded in long-term evidence. Since 1928, the S&P 500 has posted an average September return of roughly -1.1% to -1.2%, making it the weakest month of the calendar year by average performance. Over this extended period, September stands out as the only month that consistently shows a materially negative average return, while all other months have delivered positive long-term averages.
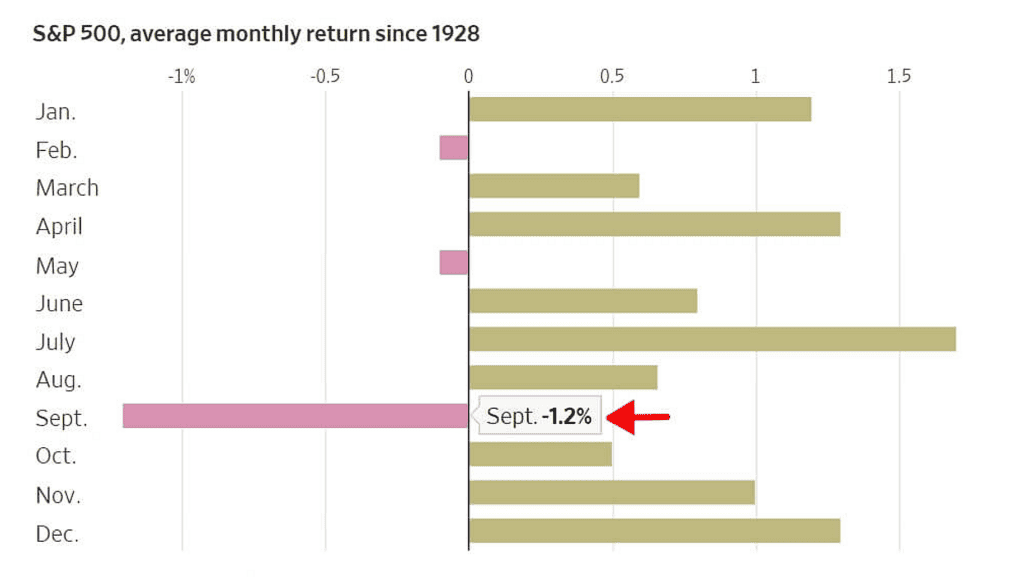
Source: FinSyn
The frequency of September declines reinforces this pattern. Historically, the S&P 500 has finished September lower about 55% to 56% of the time since 1928, more often than any other month. No other calendar month has recorded losses in a majority of years over such a long timeframe, underscoring September’s uniquely persistent weakness rather than occasional underperformance.
Recent history shows the pattern has not disappeared. Looking at the post-World War II era, September has continued to produce below-average returns, with long-term data since 1950 showing an average decline of approximately 0.6% to 0.8%. The month has also featured several sharp sell-offs during periods of economic or monetary stress. Notably, September 2022 saw the S&P 500 fall about 9.3%, marking its worst September performance since the mid-1970s.
When examined across different sample periods and market environments, September’s relative weakness remains evident. Whether measured over multiple decades, different monetary regimes, or alternative starting points, September consistently ranks as the most challenging month for U.S. equity returns, distinguishing it from other months that may underperform intermittently but lack the same long-term consistency.
Why September Struggles
Several theories attempt to explain September’s persistent underperformance, though no single factor fully accounts for the pattern. Historical analysis suggests a mix of institutional behavior, market mechanics, and investor psychology, with each contributing incremental pressure rather than acting as a standalone cause.
Trading patterns following the summer months play a role. Market activity often slows during June through August as many institutional investors take vacations. When full participation resumes in September, portfolio managers frequently rebalance holdings, exit underperforming positions, and reposition for the final quarter. This concentrated period of portfolio adjustments can create temporary selling pressure.
Institutional fund behavior may add to this effect. While fiscal calendars vary, many portfolio adjustments related to year-end reporting begin in September. Fund managers may sell losing positions to manage capital gains distributions or improve reported results, a practice commonly referred to as window dressing. Though not universal, this activity can increase seasonal selling pressure.
Bond market dynamics also intersect with September weakness. Bond issuance typically slows during the summer and rises in early fall. Increased supply of fixed-income securities can attract capital away from equities, reducing marginal demand for stocks and contributing to softer equity performance.
Government fiscal timing introduces additional uncertainty. The U.S. federal fiscal year ends on September 30, concentrating budget negotiations and shutdown risks into late September. Markets tend to react cautiously to policy uncertainty, which can encourage more defensive positioning.
Psychological explanations remain more speculative. Some research suggests seasonal changes in mood and daylight may influence investor risk tolerance. While causation is debated, these factors may reinforce existing pressures rather than independently drive September’s weakness.
The Self-Fulfilling Prophecy
One modern explanation for September’s recurring weakness focuses on investor behavior itself. September’s reputation as the market’s weakest month has been widely discussed for decades, and professional investors are generally aware of the historical pattern as part of broader risk-management and allocation decisions.
This awareness may contribute to a self-fulfilling dynamic. If a large number of investors expect September weakness and respond by trimming equity exposure, taking profits, or shifting toward defensive positions, their collective actions can increase selling pressure. In this way, expectations about seasonality may help reinforce the very pattern investors anticipate, creating a behavioral feedback loop.
There is precedent for this mechanism. Several calendar-based anomalies have weakened or disappeared after becoming widely known. The January Effect, for example, has diminished over time as investors positioned earlier and arbitraged away excess returns. September’s pattern, however, has persisted despite broad awareness, suggesting that while investor psychology may play a role, it likely operates alongside deeper structural and institutional factors rather than acting alone.
Notable Exceptions and Outliers
While September typically underperforms on average, the pattern is not ironclad. Since 1928, the S&P 500 has finished September higher in roughly 44% of years, meaning declines occur more often than gains but not overwhelmingly so. The month’s negative average return is driven largely by a small number of exceptionally poor Septembers that disproportionately skew the long-term results.
One of the most extreme examples is September 1931, when U.S. stocks fell by nearly 30% during the depths of the Great Depression, among the worst monthly declines in market history. More recent outliers include September 2008, when the S&P 500 dropped about 9.1% amid the collapse of Lehman Brothers, and September 2022, which saw a decline of roughly 9.3% as markets reacted to aggressive Federal Reserve tightening. These rare but severe drawdowns exert an outsized influence on September’s long-run average.
If the worst few Septembers are removed from the dataset, the month’s average return moves much closer to neutral. This highlights a key point: September’s weakness does not stem from steady, consistent losses each year, but from occasional sharp selloffs that have not been offset by equally strong upside months.
When September does perform well, gains tend to be limited. Since the late 1920s, the S&P 500 has posted gains above 5% in September fewer than ten times, substantially fewer than most other months. By comparison, months such as December have recorded many more 5%-plus advances. September’s challenge is therefore twofold: infrequent large rallies combined with periodic severe declines.
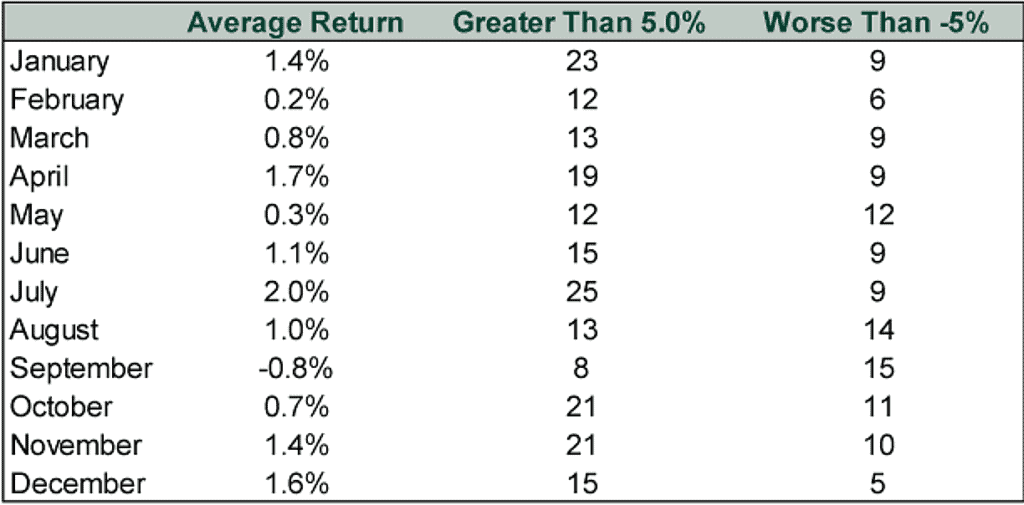
Source: Fisher Investment
The 2024 Case Study
September 2024 provided a timely test of the seasonal pattern. Markets entered the month with the S&P 500 already up roughly 20% year to date, following a sharp rebound from early-August volatility. The broader backdrop appeared supportive, with U.S. economic growth holding up, inflation continuing to moderate, and the Federal Reserve signaling that rate cuts were likely later in the year, even if the exact timing remained uncertain.
Early trading followed the familiar script. Stocks pulled back modestly during the first half of September as investors reassessed valuations and interest-rate expectations. That weakness, however, failed to gain momentum. By month-end, the S&P 500 finished higher for September, breaking from the month’s historically negative average and reinforcing that seasonal effects describe tendencies, not outcomes.
The full-year context made the lesson clearer. By early December 2024, the S&P 500 was up approximately 28% for the year. An investor who reduced exposure in late August to avoid September weakness would have missed both September’s modest gains and November’s nearly 6% rally, the strongest monthly performance of 2024. The episode illustrates how focusing too narrowly on monthly seasonality can distract from the market’s dominant trend.
Why This Matters Less Than Headlines Suggest
September represents just one month within a long investment horizon. Even with its historically weak average performance, it accounts for only one-twelfth of a single year, and an even smaller fraction of multi-decade investing outcomes. Building an investment strategy around avoiding September therefore creates more problems than it solves.
Transaction costs and taxes materially erode returns from market timing. Selling in late August and re-entering the market later typically triggers brokerage costs, potential capital-gains taxes, and opportunity costs from being out of the market. With September’s long-term average decline near 1.2%, these frictions can easily outweigh any statistical benefit from sidestepping the month.

Source: RBC Wealth Management
The risk of missing strong market days is even more consequential. Market research consistently shows that the largest single-day gains tend to occur during volatile periods, not calm ones. While September has been weak on average, it has also produced sharp rallies. September 2008, for example, finished down roughly 9% overall but included several outsized single-day advances as markets whipsawed during the financial crisis.
Most importantly, weak Septembers cannot be identified in advance. The most damaging September declines, such as those in 1931, 2001, 2008, and 2022, occurred amid broader bear markets or economic stress. In each case, September’s losses reflected existing market conditions rather than causing them. By the time the month arrived, portfolios were already under pressure, and September merely extended trends that were already in motion.
Perspective on Short-Term Patterns
Long-term market returns dwarf any monthly seasonal effects. Since 1928, the S&P 500 has delivered average annual returns of roughly 10% over the long run, despite September’s historical weakness. U.S. stocks have posted positive returns in about three-quarters of calendar years, underscoring how dominant long-term trends are relative to any single month. These long-term probabilities overwhelm any marginal edge monthly timing might theoretically offer.
When markets experience genuinely severe September weakness, it typically reflects broader forces worth monitoring rather than seasonality alone. The sharp September declines in 2001, 2002, and 2008 coincided with systemic stress, terrorist attacks, post-bubble accounting and confidence crises, and the global financial crisis, that overwhelmed normal market patterns. Conversely, when September performs well despite its weak historical average, it often signals strong underlying momentum capable of offsetting seasonal headwinds.
For beginner investors building long-term wealth, September’s historical weakness matters primarily as context, not an action signal. Knowing the month has a tendency toward volatility can help frame expectations if pullbacks occur, but it does not justify portfolio changes on its own. Markets experience volatility throughout the year; September simply concentrates slightly more of it than other months on average.
The Practical Takeaway
September often serves as a convenient reminder to review portfolios rather than a reason for dramatic action. If strong gains earlier in the year have pushed equity exposure above long-term targets, rebalancing can make sense, but that opportunity exists in any month, not specifically September.
The historical September pattern is real and well documented. It reflects genuine influences such as institutional behavior, fiscal calendars, and trading dynamics. However, its reliability is frequently overstated, its average impact is modest, and its usefulness as a timing tool is minimal for most investors.
Think of September weakness like knowing rain is slightly more likely on Tuesday than Wednesday. It’s an interesting statistical detail, not a practical planning tool. You still rely on current conditions, not the calendar.
In the same way, investors should acknowledge September’s tendency without letting it drive decisions. Focus on fundamentals, earnings, economic conditions, and valuations, rather than dates. If September brings volatility, treat it as a normal part of market behavior, not proof of seasonal folklore.
The most important investment decisions play out over years, not months. September’s historical weakness is a footnote in that longer story, not a signal that demands action.
This article is part of Mooloo’s Market Cycles & Risk sub-hub, which explains how financial markets behave across economic cycles, stress events, and systemic uncertainty without relying on forecasts or timing narratives.