Investment Myths – The Truth About “Sell in May and Go Away”- And Why You Shouldn’t

The old market saying “Sell in May and go away” is based on a real seasonal pattern, but following it has historically reduced long-term investor wealth rather than improved it. While U.S. and global stock markets have, on average, delivered stronger returns from November through April than from May through October, decades of data show that exiting the market each summer causes investors to miss compounding, strong rebound days, and frequent positive summer returns. For beginner investors, the evidence overwhelmingly favors staying invested through all seasons instead of attempting calendar-based market timing.
- The pattern exists, but it’s weak as a strategy: Long-term data shows the S&P 500 has historically returned about 6–7% from November, April versus roughly 2% from May, October.
- Market timing destroys compounding: A buy-and-hold investor since the mid-1970s dramatically outperformed a strict “Sell in May” approach, with seasonal timers capturing only a fraction of the ending wealth, according to long-run U.S. equity return studies.
- Summer gains are common, not rare: Since 1950, roughly two-thirds of May–October periods for the S&P 500 have finished positive, meaning seasonal sellers often miss real gains rather than avoid losses.
- Taxes and trading costs compound the damage: Frequent selling can trigger short-term capital gains taxes, taxed at ordinary income rates under current IRS capital gains rules, reducing after-tax returns over decades.
- Missing the best days is devastating: Studies of S&P 500 performance show that missing just the 10 best trading days over a 20-year period can cut long-term returns by roughly 40%–50%, a risk inherent in any seasonal exit strategy.
Few market proverbs have proven as persistent, or as potentially misleading, as “Sell in May and go away.” The phrase, which has circulated in financial markets for centuries, encourages investors to reduce equity exposure in late spring and return in autumn to avoid historically weaker summer returns. Its simplicity makes it appealing, but it often oversimplifies how markets actually behave. In reality, investment performance is influenced by many factors beyond the calendar.
For beginner investors considering whether to follow this advice, the critical question isn’t whether the pattern has appeared in historical data, it has. The more important question is whether it meaningfully improves long-term results. Long-term market evidence shows that while seasonal return differences exist, relying on this rule has not consistently enhanced wealth creation compared with staying invested.
The Origins and the Pattern
The complete saying originally went, “Sell in May and go away, come back on St. Leger’s Day.” It emerged in London’s financial circles and referenced the St. Leger Stakes, a British horse race first run in 1776 and traditionally held each September. The logic was practical rather than predictive: wealthy bankers, brokers, and merchants often left the city during the summer months, returning after the racing season ended. With fewer participants active, trading volumes thinned, and the seasonal pause gradually evolved into financial folklore.
Over time, the reference to the horse race faded. In modern usage, particularly in the United States, the idea shifted to selling in late spring and reinvesting in autumn, commonly around Halloween, giving rise to what is known as the Halloween indicator. The core principle remains the same: the six-month period from May through October has historically delivered weaker equity returns than November through April.
Historical market data supports this tendency, though not as a rule. Since 1990, the S&P 500 has produced modest average gains during the May, October period, while returns from November through April have been materially stronger. Broader academic research examining more than 30 international equity markets found a similar seasonal gap in the vast majority of them, with winter-month returns outperforming summer months by a wide margin.
Looking further back, long-term studies of U.S. market data show that, on average, the S&P 500 has delivered roughly 6–7% returns during the November, April period compared with about 2% during May, October. The persistence of this pattern across decades and geographies suggests it reflects a recurring historical tendency, though not a reliable strategy for long-term investors.
Why the Pattern Might Exist
Economists and behavioral researchers have proposed several explanations for the historical return gap between winter and summer months. None are conclusive on their own, but each is supported by observable market behavior.
Lower summer trading volume: Market activity often declines during summer months as institutional investors and trading desks reduce participation. Historical exchange data from U.S. equity markets shows recurring dips in trading volume between June and August. Thinner liquidity can magnify short-term price movements, occasionally increasing volatility rather than dampening it.
End-of-year financial behavior: Equity demand frequently strengthens around year-end and early in the new year. Annual bonuses, retirement contributions, and institutional inflows are commonly deployed in January and February. In addition, tax-loss harvesting in December followed by reinvestment in January can modestly tilt returns toward the November, April period.
Institutional portfolio rebalancing: Many asset managers rebalance portfolios at quarter-end or year-end after finalizing performance and allocation targets. This process can concentrate buying activity in late fall and winter, reinforcing seasonal strength during those months.
Psychological momentum: Measures of consumer and business confidence often improve during the holiday period and into the new year. While difficult to quantify precisely, improved sentiment can support higher risk tolerance and incremental equity inflows.
Global risk cycles: Academic research examining international equity markets has identified similar seasonal patterns across regions, including in Southern Hemisphere markets where seasons are reversed. This weakens climate-based explanations and supports behavioral and institutional drivers as more likely causes.
The Devastating Cost of Following the Strategy
Despite evidence that seasonal return differences exist historically, acting on the pattern has performed poorly as an investment strategy over long periods. Using long-run U.S. equity return data compiled by NYU Stern, the outcomes diverge sharply when comparing buy-and-hold investing with a strict “Sell in May” timing approach.
An investor who placed $1,000 into the S&P 500 in early 1975 and remained fully invested through 2024 would have accumulated well over $300,000, assuming dividends were reinvested.
By contrast, an investor who exited equities at the end of April each year and reinvested at the start of November, consistently following the “Sell in May” rule, would have accumulated only a fraction of that amount, commonly estimated at around $60,000–$70,000 over the same period.
The resulting gap represents a loss of roughly 75–80% of potential wealth relative to buy-and-hold investing. This underperformance is not tied to a single market cycle, it persists across nearly five decades that include multiple bull markets, recessions, inflationary periods, and policy regimes. Over time, remaining invested overwhelmingly outperformed seasonal market timing by a wide margin.
Why the Strategy Fails in Practice
The failure isn’t mysterious. It reflects several enduring realities about compounding, market participation, and investor behavior. First, the May, October period still produces positive returns more often than commonly assumed. Since 1950, roughly 65% of May, October periods for the S&P 500 have ended higher than they began. On average, this six-month stretch has delivered returns of about 1.5%–2% on a price-return basis. Sitting out the market for half the year therefore means forfeiting gains that occur with regular frequency, not only during exceptional years.
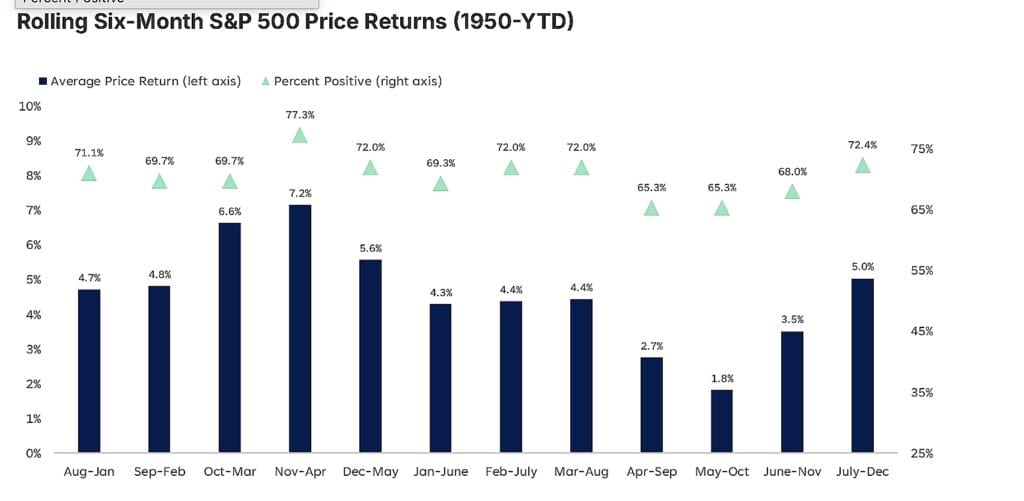
Source: Investing.com
Second, recent history shows the seasonal gap weakening further. From 2013 through 2024, the S&P 500’s May, October period averaged approximately 4.9%, with about 82% of those intervals finishing positive. In 2023, depending on measurement dates, the index gained roughly 3%–5% during the summer months, returns investors would have missed entirely by following a rigid “sell in May” strategy.
Trading also introduces friction. Even in a low-commission environment, bid–ask spreads, execution timing, and reinvestment risk compound over time. Taxes add a heavier drag. Selling investments held for one year or less triggers short-term capital gains taxes, taxed at ordinary income rates of up to 37%, compared with 15%–20% for long-term gains on assets held longer than twelve months. Over multi-decade horizons, this tax inefficiency alone can reduce compounded wealth by meaningful double-digit percentages.
The Danger of Missing the Market’s Best Days
Perhaps the most damaging flaw in any market-timing strategy, including “Sell in May”, is the risk of missing the market’s strongest trading days. Long-term return data shows that between 2004 and 2024, an investor who remained fully invested in the S&P 500 earned an annualized return of approximately 9.5%. Missing just the 10 best trading days during that period reduced annualized returns to roughly 5.3%, representing a performance decline of about 44%. Missing 20 or 30 of the best days caused returns to fall even further, dramatically eroding long-term wealth.
Crucially, those best days do not occur at random. Market history shows that roughly three-quarters of the strongest single-day gains tend to cluster during bear markets or early recovery phases, when volatility is elevated and investor sentiment is most pessimistic. These rebounds often occur suddenly, following sharp sell-offs, making them extremely difficult to capture for investors who step aside during periods of perceived weakness.
Because long-term market returns are heavily influenced by a relatively small number of outsized positive days, missing even a handful can have lasting consequences. Over multi-decade horizons, being absent for those key sessions can result in roughly half the ending portfolio value compared with an investor who stayed continuously invested.
When Recent Data Seemed to Support the Strategy
In November 2024, the S&P 500 posted its best monthly gain of the year, rising about 5.7%, a strong move that looked like a textbook seasonal rebound. However, that strength did not carry through December 2024, when the broad index drifted lower instead of showing the typical year-end rise, resulting in one of the rare years in which the so-called year-end seasonal advance did not materialize. Throughout the final stretch of 2024, market action became more uneven and volatile rather than showing a sustained rally.
The mixed result highlighted a basic flaw of purely seasonal strategies: averages may hold over long periods, but short-term individual years often deviate significantly from historical patterns. A successful seasonal investor must time multiple decisions correctly, when to exit, when to re-enter, what to hold in the interim, and at what prices. Each of these decision points introduces new risks, and none of them come with reliable, consistent signals that guarantee better outcomes than simply staying invested through market cycles.
What About Sector Rotation Instead?
Some modern investors have proposed sector rotation as a softer alternative to seasonal investing. Rather than exiting equities altogether, the strategy shifts exposure, tilting toward cyclical sectors such as technology, energy, and consumer discretionary during stronger market phases, then rotating into defensive sectors like utilities, healthcare, and consumer staples during historically weaker months.
Long-term backtests using U.S. sector data from roughly 1990 through the late 2010s do show limited seasonal tendencies. Defensive sectors have, on average, delivered relatively better risk-adjusted performance during the May, October period, while more growth-oriented sectors have tended to lead during November, April. Some rotation models tested over these periods produced high-teens annualized returns, often with shallower drawdowns than the broader market, but only under ideal timing and frictionless assumptions.
In practice, the strategy faces the same structural challenges as other forms of market timing. Sector leadership shifts frequently and without clear signals, making consistent execution difficult. Regular reallocations increase trading activity, amplifying transaction costs and bid, ask spreads. In taxable accounts, repeated rotations also generate ongoing capital-gains taxes, reducing after-tax returns. As a result, real-world outcomes often fall short of historical backtests, limiting sector rotation’s reliability as a long-term strategy.
The Better Approach for Beginners
For new investors, one principle consistently outperforms folklore: stay invested. Ignore catchy maxims like “Sell in May.” Instead, focus on building a diversified portfolio aligned with long-term goals, and remain committed to it through every season.
Understanding seasonality can still be useful from an educational standpoint. It helps explain why markets may feel sluggish during certain months without encouraging overreaction. When summer performance softens, it reflects a common historical tendency, not a signal to abandon a sound plan. When winter markets rally, recognize that history accounts for much of that strength, rather than any special timing insight.
The broader evidence is clear. Since 1928, the S&P 500 has delivered positive calendar-year returns roughly 75%–80% of the time. Over rolling 10-year periods, the probability of a positive return rises to about 90%–95%, depending on the starting year. Seasonal strategies do little to improve these already favorable long-term odds.
Every dollar lost to unnecessary taxes or trading costs is a dollar that cannot compound. Every missed market day forfeits momentum that cannot be recovered. And every successful timing decision must be repeated correctly hundreds of times over decades to meaningfully improve outcomes, something even professional investors struggle to achieve consistently.
“Sell in May and go away” endures because it is simple, memorable, and sounds prudent. But evidence across generations of market data shows a different reality: while the pattern exists statistically, acting on it tends to erode long-term wealth. For most investors, understanding seasonality provides perspective; trading on it creates risk. The real advantage does not come from calendar timing, it comes from consistency, discipline, diversification, and patience.
This article is part of Mooloo’s Market Cycles & Risk sub-hub, which explains how financial markets behave across economic cycles, stress events, and systemic uncertainty without relying on forecasts or timing narratives.