Decoding the VIX: What Wall Street’s “Fear Gauge” Really Tells Investors

The VIX is the Cboe’s real-time gauge of expected 30-day volatility in the S&P 500, and newer investors often wonder what a reading like 18, 25, or 35 really means during market swings. The key insight is that the VIX measures expected magnitude of movement, not direction, and tends to rise when fear increases. Typical readings fall between 12–20 in calm markets, while levels above 30 signal elevated uncertainty, similar to periods seen in the 2020 COVID-19 shock and the 2008 financial crisis. Understanding these ranges helps investors avoid misinterpreting headlines and stay grounded during turbulence.
- A VIX in the 12–20 range usually reflects normal market conditions, while readings above 30 indicate stressed sentiment and elevated hedging demand.
- The VIX moves inversely to stocks because falling markets increase demand for options protection, raising implied volatility.
- It measures expected volatility, not whether markets will rise or fall, and applies only to the S&P 500, not individual stocks.
- High-VIX periods can make options pricier and create tactical opportunities (e.g., richer premiums for cash-secured puts) but shouldn’t dictate long-term strategy.
- For most new investors, the VIX is best used as context, a sentiment thermometer, rather than a timing tool.
If you’ve ever watched financial news during a market downturn, you’ve probably heard urgent references to “the VIX spiking” or “fear gripping Wall Street.” A commentator might cite a number, 25, 35, or during severe disruptions, something even higher, and the tone implies that this figure carries unusual importance. But what exactly is this VIX, what does it measure, and should newer investors actually pay attention to it?
The Volatility Index, widely known as the VIX, is one of the most closely monitored indicators in today’s financial markets. Created by the Chicago Board Options Exchange (now Cboe Global Markets) and introduced in 1993, the VIX is called the “fear gauge” because it typically rises when uncertainty increases and falls when confidence returns. It measures the market’s expected 30-day volatility based on real-time S&P 500 index option prices, not historical swings. Understanding what the VIX captures, how to interpret different readings, and where it fits into overall market behavior can help investors approach periods of turbulence with more clarity and perspective.
What the VIX Actually Measures
The VIX calculates the market’s expectation of volatility over the next 30 days based on the prices of options contracts on the S&P 500 index. This requires unpacking several concepts. The S&P 500 represents 500 of America’s largest publicly traded companies across all major sectors, making it the most widely followed barometer of U.S. stock market health. When people talk about “the market” being up or down, they’re often referencing the S&P 500.
Options are contracts that give traders the right, but not the obligation, to buy or sell stocks at predetermined prices before certain dates. Think of them as insurance policies or bets on future price movements. A call option gives you the right to buy at a set price, useful if you think prices will rise. A put option gives you the right to sell at a set price, valuable if you expect prices to fall. When investors get nervous about the market’s direction, they buy more options as protection or to profit from expected volatility. Increased demand for options drives their prices higher.
The VIX uses sophisticated mathematics to aggregate the weighted prices of S&P 500 options with various strike prices, focusing on contracts that expire roughly 30 days out. The calculation reveals what price level investors are collectively willing to pay for the right to buy or sell the S&P 500. Higher option prices indicate investors expect more volatile price swings. Lower option prices suggest expectations of calmer markets.
The resulting VIX value is expressed as a percentage representing the anticipated annualized movement of the S&P 500 over the next 30 days at a 68% confidence level. A VIX reading of 20 suggests the market expects the S&P 500 could move up or down by approximately 20% over the next year, or about 5.8% over the next month. It’s important to note this isn’t a prediction of direction, just magnitude of potential movement in either direction.
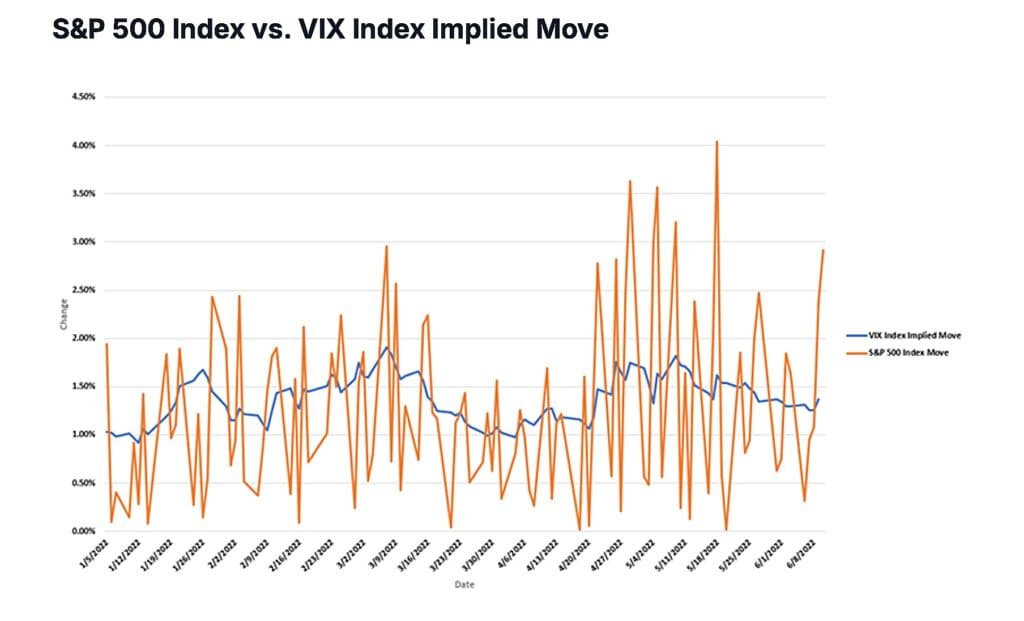
Source: Cboe
Understanding VIX Levels: What the Numbers Mean
The VIX usually trades in the 12–20 range during stable market conditions, although “normal” varies by decade and macro environment. Understanding how different VIX levels correspond to market behavior helps investors interpret sentiment and the market’s expectation of future volatility.
A VIX below 15 generally signals calm, stable markets. Investor confidence is high, option prices tend to be low because demand for protection is limited, and equity markets often rise steadily. Very low levels, typically below 12, are sometimes viewed as signs of complacency, meaning investors may be underestimating potential risks. Historically, extended periods of single-digit VIX readings have been uncommon but have happened (e.g., 2017).
A VIX between 15 and 20 reflects a typical, non-stressed trading environment. Markets expect routine uncertainty around earnings, economic data, or policy decisions, but there is no broad fear. This range dominated long stretches of the post-2008 recovery period and the pre-pandemic years.
When the VIX moves into the 20–30 range, uncertainty is elevated. Market participants are pricing in larger near-term swings due to concerns about economic indicators, geopolitical tensions, or financial conditions. Options become more expensive as demand for hedging rises. Stock markets during these periods often show wider daily fluctuations. While this range doesn’t imply a crash, it does indicate declining confidence.
A VIX above 30 is widely considered a sign of significant market stress or fear. Markets are either experiencing or bracing for sharp volatility. Stocks typically fall, sometimes violently, as investors rush for protection. Option prices rise sharply as volatility becomes the dominant component of premium costs.
Historical extremes confirm this pattern. The highest VIX reading on record is 82.69, set on March 16, 2020, during the COVID-19 market collapse. This surpassed the previous peak of 80.86 in November 2008, recorded at the height of the global financial crisis. Other notable spikes occurred during:
-
1998: Asian financial crisis and Russian default
-
2001–2002: Dot-com bust and post-9/11 uncertainty
-
2011: European sovereign debt crisis and U.S. credit rating downgrade
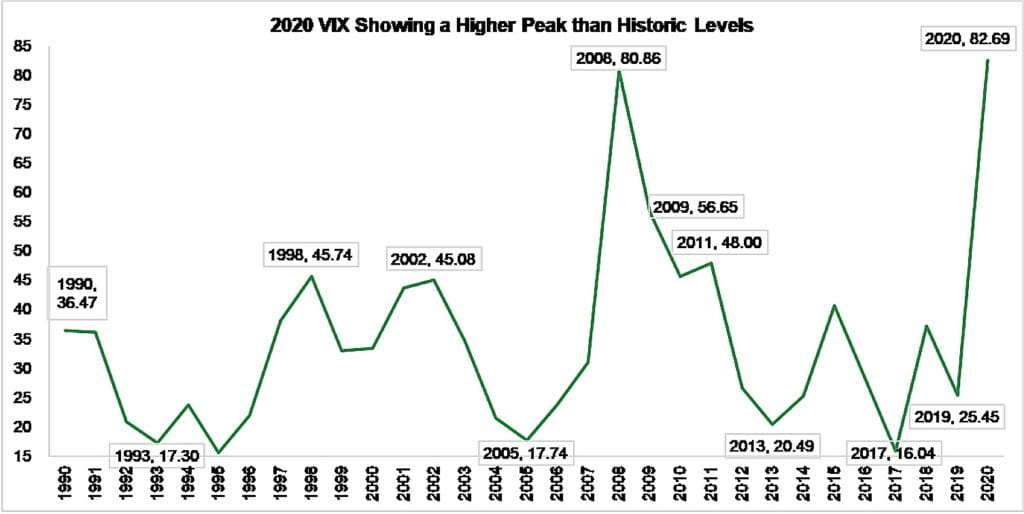
Source: SIFMA
These extreme spikes are temporary. The VIX always eventually returns to lower levels as uncertainty fades, even though stock prices may settle at very different levels after the turbulence.
The Inverse Relationship with Stock Prices
One of the VIX’s most reliable characteristics is its inverse correlation with stock market performance. When stocks fall, the VIX typically rises. When stocks rally, the VIX usually declines. This relationship makes intuitive sense. Falling stock prices create uncertainty and fear, driving investors to buy options for protection, which raises options prices and thus the VIX. Rising stock prices build confidence, reducing demand for protective options, lowering their prices, and causing the VIX to fall.
However, this inverse relationship isn’t perfect or instantaneous. Sometimes stocks and the VIX move in the same direction temporarily, particularly during periods of extreme volatility where prices swing wildly in both directions. And the VIX measures expected future volatility, not current stock market direction, so it can rise even as stocks rise if investors become concerned about upcoming events or data releases.
This relationship has led some investors to use VIX-related investments as portfolio hedges. When stocks decline and portfolios lose value, VIX-linked positions might gain, offsetting some losses. However, implementing this strategy effectively requires sophisticated understanding because VIX-based investments behave differently than simple stock positions.
What the VIX Doesn’t Tell You
Understanding the VIX’s limitations is as important as understanding what it measures. First and most importantly, the VIX doesn’t predict the stock market’s direction. It measures expected volatility, potential movement in either direction, not whether the market will go up or down. A rising VIX suggests bigger swings ahead but not which way those swings will go.
How Should Investors Use the VIX?
For newer investors building long-term wealth, the VIX serves primarily as context rather than a trading signal. When you see the VIX spike above 30 or 40 during a market selloff, it confirms what you’re already feeling: markets are turbulent and uncertain. This can be helpful psychologically. Knowing that volatility is elevated and that investors collectively are nervous can make your own anxiety feel more rational and help you avoid panic-driven decisions.
The VIX can also help with tactical decisions around the edges of your long-term strategy. When the VIX is elevated, options on individual stocks become more expensive because implied volatility is a key component of options pricing. Selling cash-secured put options to potentially acquire stocks at lower prices while collecting premium income becomes more attractive as premiums rise. Conversely, buying protective puts becomes more expensive during high-VIX periods, making this strategy less cost-effective precisely when you might want protection.
Some investors look for opportunities when the VIX is elevated, viewing high readings as potential buying opportunities for stocks. The logic is that when fear is high, stocks often get oversold and priced below long-term value. This contrarian idea has held merit historically, buying during VIX spikes has often proven profitable over subsequent months and years, but requires strong conviction and available capital when markets feel most frightening.
For investors trading individual stocks rather than broad index funds, remember the VIX measures S&P 500 volatility specifically. Your individual holdings may behave differently. A high VIX reflects market-wide uncertainty, but some stocks and sectors handle volatility better than others. Defensive sectors like utilities, consumer staples, and healthcare often see less volatility than technology, small-cap stocks, or financial companies.
Is the VIX More Relevant Today Than a Decade Ago?
The importance of the VIX has arguably increased over the past decade for several reasons. Options trading has grown sharply as retail investors gained access through low-cost platforms and institutions expanded their use of complex strategies. With more options activity, the VIX captures a wider range of market expectations, making it more reflective of overall sentiment.
Market volatility has also followed different patterns. From 2012 to 2019, volatility stayed unusually low as central banks kept policies accommodative. Since 2020, volatility spikes have become more frequent, the COVID-19 crash, the 2022 inflation cycle and rate hikes, banking concerns, and geopolitical tensions. This shift makes volatility measures more important for understanding market conditions.
The rise of VIX-linked investment products has increased its practical relevance as well. Trading in VIX futures, VIX options, and related exchange-traded products has grown dramatically, sometimes creating feedback effects where activity in these products influences volatility expectations.
Social media and instant news flow also move sentiment faster than before. The VIX, as a real-time gauge of implied volatility, helps show whether sudden headlines are being reflected in how investors are pricing risk.
The Bottom Line for New Investors
The VIX is a useful tool for understanding market conditions and investor psychology, but it shouldn’t drive your core investment strategy. If you’re investing for long-term goals, short-term volatility, whether the VIX is 15 or 35, matters far less than staying invested, diversifying, and keeping a plan suited to your risk tolerance and time horizon.
Think of the VIX like a thermometer. When it shows a fever, a reading above 30, it tells you conditions are stressed. That’s useful context. It may influence how quickly you invest new cash or help explain why your portfolio is moving more than usual. But just as a fever doesn’t diagnose the illness, the VIX doesn’t tell you whether to sell, buy, or hold.
For most newer investors, the best use of the VIX is educational. Watch how it reacts during different market periods. See how it spikes during selloffs and eases during recoveries. Notice how high VIX levels often align with louder headlines and heightened concern. This helps you recognize emotional extremes and avoid reacting emotionally yourself.
The VIX will keep rising and falling, reflecting the market’s collective anxiety or calm. Knowing that it measures expected volatility, not direction, and reflects sentiment, not certainty, helps you use it without being misled. Properly understood, it offers a clear window into market psychology and can help newer investors handle volatility with more confidence.
Related: This article is part of our broader Investing Hub, where you’ll find guides on market behavior, ETF research, asset allocation, and long-term wealth planning.