Farmland as an Asset Class: What the NCREIF Numbers Say About Returns and Volatility

Farmland has evolved from a niche investment into a recognized institutional asset class, one that blends stable income, long-term appreciation, and inflation protection. According to the NCREIF Farmland Index, U.S. farmland has delivered roughly 10% average annualized returns since 1990, outperforming many traditional assets with lower volatility and weak correlation to stocks or bonds. While the 2024 report showed a rare dip in cropland values, the long-term fundamentals, rising food demand, finite land supply, and inflation sensitivity, remain intact for investors with patient capital and a tolerance for illiquidity.
- Competitive Returns: NCREIF data show ~10% annualized farmland returns over decades, combining steady income and long-term appreciation.
- Lower Volatility: Farmland’s value shifts gradually, showing 6–7% annual volatility versus 16–18% for the S&P 500.
- Diversification Benefits: Historically near-zero correlation with equities and bonds, offering true diversification during market downturns.
- Inflation Hedge: USDA data show farmland values rising 10–12% in 2022 as U.S. inflation neared 9%, underscoring inflation sensitivity.
- Caveats: Illiquidity, appraisal smoothing, climate risk, and high entry barriers limit access and may affect realized performance.
For decades, farmland investment remained the domain of farming families and a handful of specialized investors who understood soil quality, crop yields, and commodity markets. But over the past few decades, institutional investors have increasingly viewed agricultural land through a different lens, as a distinct asset class with attractive risk-return characteristics worthy of inclusion in diversified portfolios.
The challenge has always been data. Unlike publicly traded stocks or even commercial real estate, farmland transactions are private, infrequent, and highly variable by location and crop type. This opacity made it nearly impossible for institutional investors to benchmark performance or compare farmland returns against traditional asset classes.
Enter the NCREIF Farmland Index, launched in 1990 to track the quarterly performance of institutional-quality U.S. agricultural properties. The index provides standardized data on farmland investment performance across the country, helping investors evaluate returns and volatility relative to other asset classes.
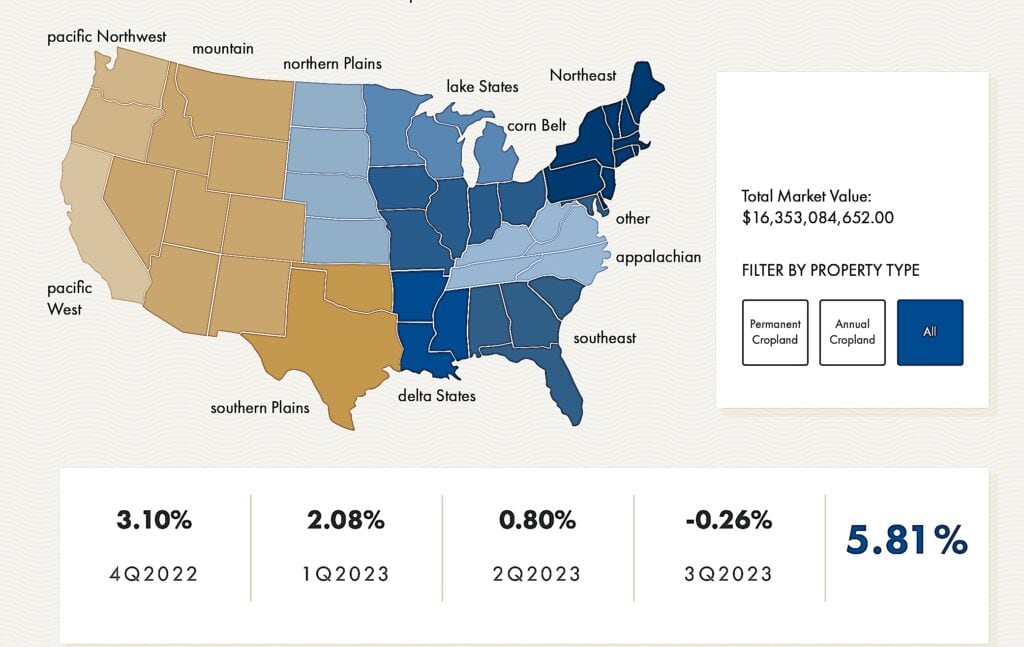
Source: NCREIF Farmland Index
Historical results show average annualized returns near 10%, though the 2024 report marked the index’s first negative year amid softer cropland values. What the numbers reveal is both instructive and enduring for those considering farmland’s role in modern portfolios.
The Return Story: Competitive Performance
According to data from the National Council of Real Estate Investment Fiduciaries (NCREIF), farmland has delivered strong annualized total returns over multi-decade periods, averaging around 10% per year, performance that compares favorably to many traditional asset classes. This total return consists of two components: income returns from crop production or rental income, and capital appreciation as land values rise over time.
Farmland returns differ from equities in their underlying drivers. The income component reflects agricultural productivity, farmers growing corn, soybeans, wheat, or permanent crops like almonds and grapes. This income stream has remained relatively stable compared to corporate dividends, as food demand persists regardless of economic cycles.
The appreciation component stems from increased agricultural productivity, growing global food demand, inflation that raises replacement costs, and the fundamental scarcity of prime farmland, after all, they’re not making any more of it.
Regional variations play a key role. Row-crop farmland in the Midwest, such as Iowa corn and Illinois soybeans, has historically produced steady returns, while permanent crop properties in California, growing almonds, wine grapes, or citrus, have shown higher volatility linked to commodity price swings and water availability.
The Volatility Picture: Lower Than Equities
Here’s where farmland’s profile becomes particularly interesting for institutional investors. While delivering competitive returns, data from the NCREIF Farmland Index shows farmland exhibits lower volatility compared to public equities. Over multi-decade periods, farmland’s annual return variability has averaged around 6-7%, compared to roughly 16-18% for the S&P 500. This confirms farmland returns have historically shown less dramatic swings than stock market performance.
This lower volatility stems from several structural factors. First, farmland valuations change gradually because agricultural property doesn’t trade on public exchanges where prices can swing daily based on Federal Reserve policy shifts. Appraisals occur quarterly, reflecting more stable underlying values. Second, the cash flows from farming operations remain relatively consistent, while weather and commodity prices fluctuate annually, multi-year averages tend to stay steady.
Critics rightfully note that appraisal-based indices can artificially dampen volatility, a phenomenon known as “appraisal smoothing.” If farmland were marked-to-market daily like stocks, volatility would appear higher. However, even accounting for this limitation, farmland’s fundamental income stability and long-term land value appreciation suggest its true volatility remains well below equities.
The practical implication: farmland offers an appealing combination of solid returns with relatively lower volatility, resulting in favorable risk-adjusted return characteristics that make it a compelling addition to diversified institutional portfolios.
Correlation Benefits: True Diversification
Perhaps farmland’s most valuable characteristic from a portfolio construction perspective is its low correlation with traditional asset classes. Data shows that U.S. farmland returns have historically exhibited weak correlation with equities and bonds, often hovering near zero or slightly negative. This means farmland values don’t move in lockstep with stock prices.
During major market downturns, farmland has often shown greater resilience than equities. In the 2008 financial crisis, while the S&P 500 dropped sharply, the NCREIF Farmland Index recorded modest gains, demonstrating the sector’s defensive qualities.
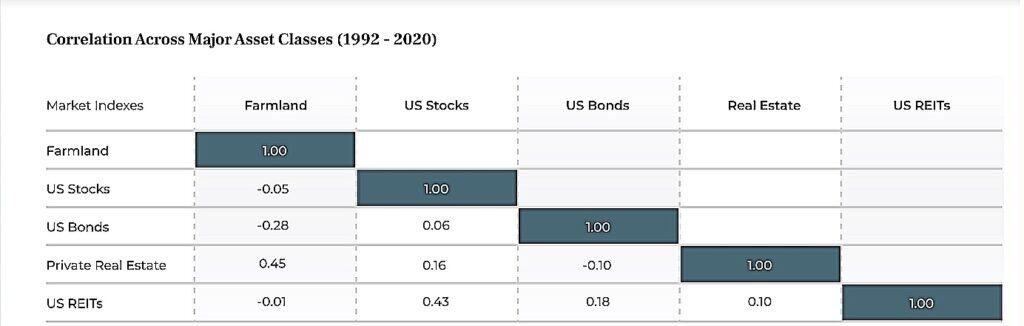
Source: Farm Together
This weak correlation stems from farmland’s dependence on agricultural fundamentals, crop prices, land productivity, weather patterns, and global food demand, rather than corporate earnings, investor sentiment, or short-term monetary policy shifts. Although interest rates and input costs can influence valuations, farmland remains largely insulated from the daily volatility affecting financial markets.
For institutional investors, this profile provides genuine diversification, not merely another form of equity exposure. Research from Nuveen confirms that adding farmland to a traditional stock-bond portfolio can reduce overall volatility while maintaining competitive long-term returns.
Inflation Protection: A Natural Hedge
Farmland has historically served as an effective inflation hedge, a trend supported by NCREIF Farmland Index data. During periods of elevated inflation, farmland returns have typically kept pace with or exceeded inflation rates.
In 2022, when U.S. inflation neared 9%, farmland values rose about 10–12%, according to USDA data. The mechanism is straightforward: inflation raises food prices, boosting farm income and supporting higher land values. At the same time, rising replacement costs create a higher floor for valuations, giving farmland natural inflation sensitivity.
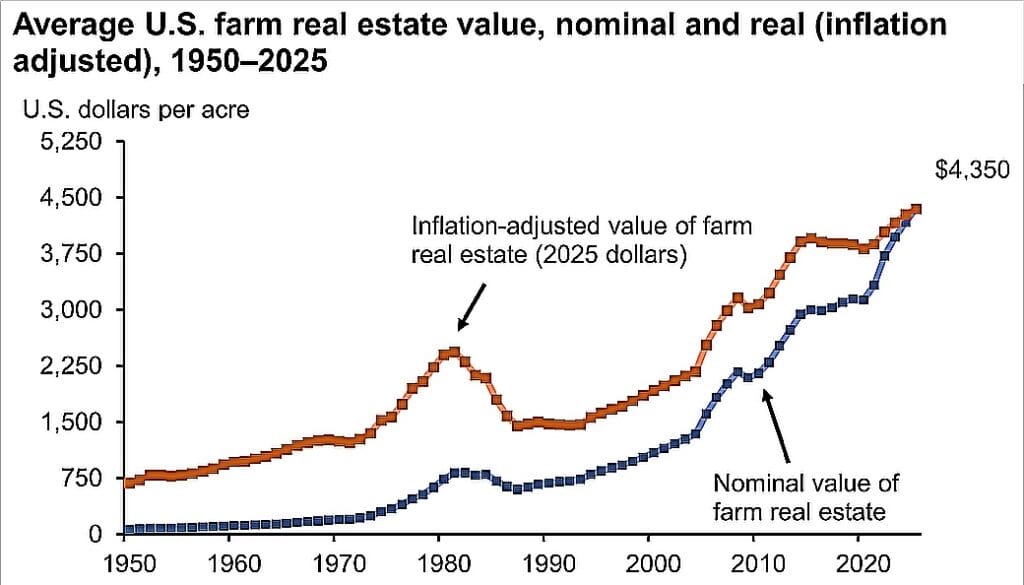
Source: USDA
In today’s environment of renewed inflation concerns, this characteristic has drawn greater institutional attention. While Treasury Inflation-Protected Securities (TIPS) protect purchasing power with modest yields, farmland offers similar inflation protection with the potential for higher real returns.
The Caveats: What the Numbers Don’t Tell You
Before allocating capital to farmland, investors should recognize what the NCREIF Farmland Index doesn’t fully capture. The index tracks institutional-quality properties owned by large investors and managed by professional operators, representing the upper tier of agricultural assets. Individual investors purchasing farmland directly may see very different outcomes.
Liquidity remains farmland’s key limitation. Unlike stocks that can be sold instantly, farmland sales can take months and involve substantial transaction costs such as broker commissions, legal fees, and closing costs. The NCREIF methodology does not incorporate these illiquidity costs into reported returns.
Climate change adds new uncertainty that historical data cannot anticipate. Evolving weather patterns, water scarcity in key regions, and extreme weather events could influence yields and valuations in ways past performance does not reflect. Likewise, technological shifts, from vertical farming to alternative proteins, may reshape demand for traditional farmland over time.
Finally, access remains unequal. Institutional farmland funds often require large minimum investments and charge management and performance fees. While farmland REITs and crowdfunding platforms have lowered entry barriers, their returns and risk profiles may differ significantly from those of direct institutional ownership.
The Bottom Line
The NCREIF Farmland Index shows that farmland has earned its place as a distinct asset class in institutional portfolios. With historically strong returns, lower volatility than equities, and low correlation with traditional assets, farmland offers meaningful diversification benefits. Its inflation-sensitive nature further enhances its appeal as a potential hedge in periods of rising prices.
Still, past performance doesn’t guarantee future results. Agriculture faces structural challenges, from climate risks and water scarcity to shifting consumer diets and technological disruption, that historical data cannot fully anticipate. Farmland also remains illiquid and requires significant capital, making it suitable primarily for investors with long horizons and higher risk tolerance.
For those able to access quality agricultural assets and hold them over time, the data indicate that farmland can serve as both a portfolio stabilizer and a resilient store of real value in an uncertain economic environment.
This article belongs to Mooloo’s Asset Classes series, which examines how different assets behave over time and how they are used together to build resilient portfolios. View the full Asset Classes overview to see how each asset fits within a broader investment structure.