Gold at Record Highs: Why It’s Less Volatile Than You Think (And Far Safer Than Bitcoin)

Gold’s surge above $3,900/oz in October 2025 may look like a bubble, but data shows a deeper story: volatility now matches the S&P 500 (~15%) a far cry from its wild 1970s swings. With central banks buying over 1,000 tonnes annually and real yields softening, this rally reflects structural reserve diversification, not retail euphoria. For investors, gold’s risk profile is now closer to equities, yet it remains inversely correlated during crises, offering rare defensive value in a volatile macro regime.
- Volatility parity: Gold’s 10-year annualized volatility (~15%) now mirrors the S&P 500’s (~16%), per State Street Global Advisors.
- Institutional demand: The World Gold Council reports three straight years of >1,000-tonne central-bank purchases, driven by de-dollarization, not speculation.
- Performance resilience: During past crises (2000–2002, 2008–2009, 2020), gold rose 25–45% while equities plunged 30–55%.
- Bitcoin contrast: Gold’s 15% volatility vs. Bitcoin’s ~54% underscores its defensive role; Bitcoin behaves as a risk-on asset per iShares data.
- Investor takeaway: Even at record highs, 5–10% portfolio exposure offers diversification and drawdown protection, especially when equities and crypto remain structurally unstable.
Gold’s climb to fresh all-time highs has reignited a familiar debate: is it too risky to buy at the top? The answer, supported by historical and quantitative evidence, is far more nuanced than simple price levels suggest. While skeptics fear entering at record valuations, gold’s risk profile today is surprisingly stable and statistically similar to that of the S&P 500. And when compared to the roller-coaster volatility of Bitcoin, gold’s performance looks almost tranquil.
Gold’s Surprising Stability Over Two Decades
The notion that gold is inherently erratic has been dismantled by modern data. According to State Street Global Advisors, gold’s annualized volatility over the past decade averages ~15%, nearly identical to the S&P 500’s ~16%.
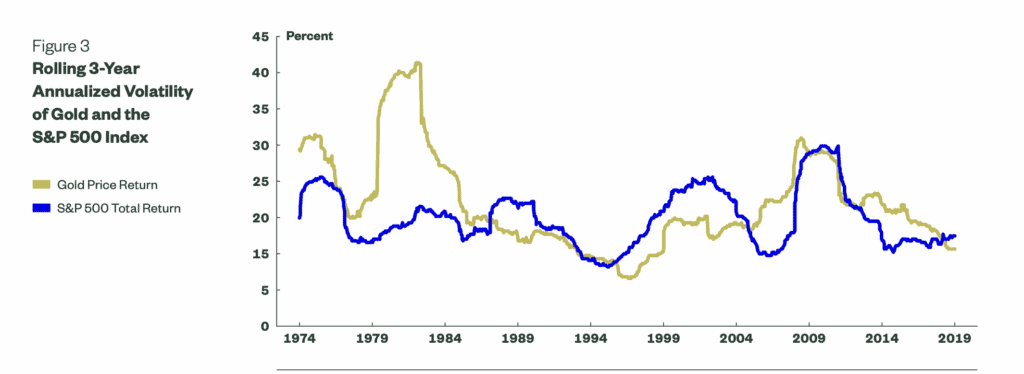
Source: State Street Global Advisors,
This represents a dramatic structural change: during the 1970s and early 1980s, when gold was still re-pricing after the end of the Bretton Woods system, volatility routinely exceeded 25–30%.
That convergence marks one of the most significant portfolio developments in modern finance. Gold now behaves not as a speculative metal but as a macro-driven reserve asset, influenced by real yields, monetary policy expectations, and institutional flows rather than retail speculation.
Gold’s Price Path Since 2000
Gold’s two-decade performance reflects its transformation from a volatile commodity into a macro-driven global reserve asset.
2000 – The Base of a Modern Bull Cycle (~$272/oz)
At the turn of the millennium, gold traded around $272 per ounce, marking the bottom of a two-decade bear market. This period laid the foundation for a new bull cycle as monetary easing and rising debt levels began reshaping investor demand for real assets.
2011 – Peaked Near $1,920 Amid QE and Debt Fears
By September 2011, gold surged to roughly $1,920/oz, its highest price at the time. The rally was driven by quantitative easing programs following the 2008 financial crisis and heightened sovereign debt concerns in both the U.S. and Europe, fueling a powerful safe-haven bid.
2013 – Fell 28% After the Fed’s Taper Signal
In 2013, gold experienced one of its steepest modern corrections, falling about 28% after the Federal Reserve signaled tapering of its bond-buying program. Prices slid from around $1,675 to near $1,200 per ounce, marking the end of the post-crisis surge and beginning a multi-year consolidation.
2020 – Pandemic Surge to $2,070/oz
During the COVID-19 crisis, gold reaffirmed its defensive nature, climbing to $2,070/oz in August 2020, a new record at the time. The rally reflected massive fiscal stimulus, collapsing real yields, and a flight to safety as global economies shut down.
2024 – Above $2,400 on Central-Bank Accumulation
In 2024, gold repeatedly broke above $2,400, posting more than 40 new record highs. The World Gold Council attributed the surge to record central-bank buying, persistent inflation, and renewed de-dollarization trends as emerging markets diversified reserves away from the U.S. dollar.
2025 – Record Highs Beyond $3,900/oz
Gold’s momentum accelerated in 2025, propelled by rate-cut expectations, a softening U.S. dollar, and geopolitical uncertainty.
-
The Q2 2025 average reached about $3,280/oz, the highest quarterly average ever recorded.
-
Spot gold surged to $3,895/oz in early October 2025, briefly breaking $3,900/oz in subsequent sessions.
-
As of mid-October 2025, prices trade around $3,984/oz, nearly 52% higher year-over-year, marking the strongest annual performance in modern history.
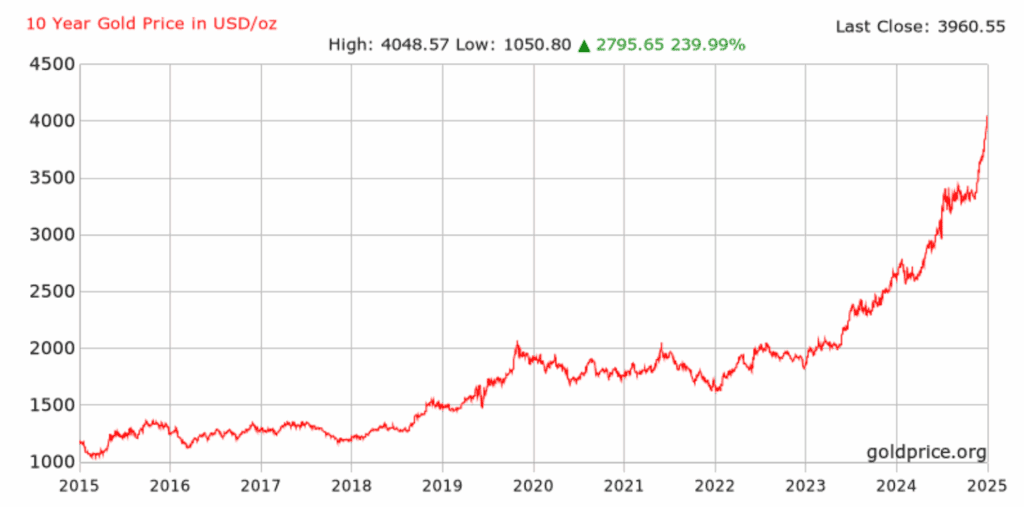
Source: GoldPrice
What makes this rally distinct is its composition, not a retail frenzy but a quiet, structural rotation by central banks and institutional allocators. According to the World Gold Council, official sector purchases exceeded 1,045 tonnes in 2024, marking the third consecutive year above the 1,000-tonne threshold. This steady accumulation is a long-term, strategic move to diversify reserves away from the U.S. dollar, not a speculative bet.
Stock Market Volatility Tells a More Dramatic Story
While the S&P 500’s long-term volatility hovers near 16%, that number conceals devastating collapses and multi-year recovery periods:
2000–2002: The dot-com bust erased roughly 49% of market value from March 2000 to October 2002. It took about 7½ years, until October 2007, for the index to fully recover its prior peak.
2007–2009: The Global Financial Crisis wiped out 56.8% of the S&P 500’s value, marking the steepest decline since the Great Depression.
March 2020: The COVID-19 panic triggered a 33.9% drop in just 33 days, the fastest bear market on record.
Gold’s behavior during these crises provides the ultimate stress test:
| Crisis Period | S&P 500 Return | Gold Return | Observation |
|---|---|---|---|
| 2000–2002 Dot-Com Bust | –49% | +26% (from $273 to $343/oz, | Safe-haven behavior confirmed |
| 2007–2009 Financial Crisis | –56.8% ) | +44% (from $842 to $1,215/oz, | Negative correlation preserved |
| 2020 COVID Panic | –33.9% | +25% (full-year gain from $1,517 to $1,896/oz, | Gold hit record highs amid equity panic |
This divergence reveals gold’s asymmetric payoff profile, limited downside during crises but strong upside in systemic risk events. Over decades, that pattern compounds into superior risk-adjusted returns, even when gold’s nominal performance trails equities.
Bitcoin Exposes the Meaning of True Volatility
Bitcoin’s emergence as a self-styled “digital gold” offers the clearest contrast for understanding gold’s actual risk profile. According to iShares research by BlackRock, Bitcoin has historically averaged around 54% annualized returns from 2014–2024, though its volatility, at roughly 54%, is about 3.6 times higher than gold’s, which averages around 15%.
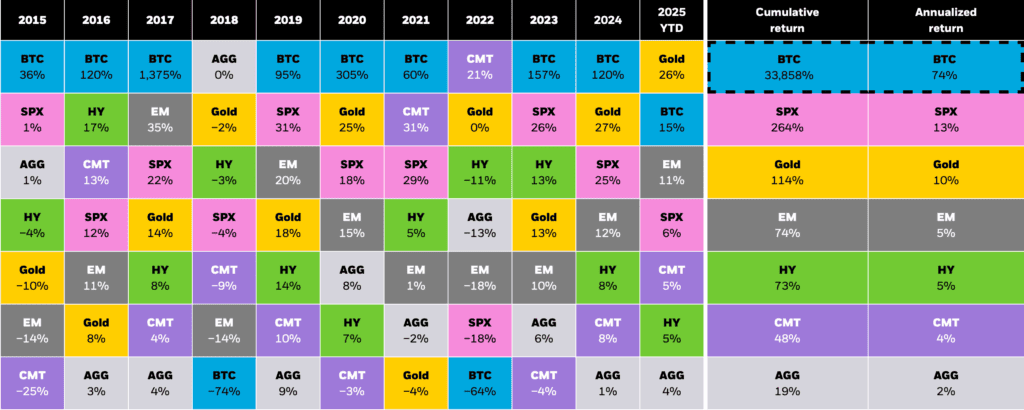
Source: iShares
However, independent data from StatMuse shows that Bitcoin’s total return over that decade was approximately 12,275%, translating to a compound annual growth rate (CAGR) of about 34–35%, significantly lower than the simple average return cited by iShares.
This reinforces the broader point: while Bitcoin delivers outsized long-term gains, it does so with a substantially higher volatility profile than gold, underscoring their fundamentally different roles in portfolio construction, gold as a stabilizer, and Bitcoin as a high-beta, risk-on asset.
Bitcoin’s extreme drawdowns:
-
-
2017–2018: Bitcoin collapsed about 83% from its December 2017 peak near $19,800 to around $3,200 in December 2018, one of its deepest bear markets on record.
-
2021–2022: From the November 2021 all-time high of $69,000, Bitcoin fell roughly 77%, bottoming near $15,500in November 2022.
-
March 2020: During the COVID-19 liquidity crisis, Bitcoin plunged about 40% intraday on March 12, 2020, and roughly 37% on a daily closing basis, one of the sharpest single-day drops in its history.
-
These aren’t corrections – they’re wealth destruction events that would devastate most investors. While gold’s worst drawdown reached 28% over nearly two years, Bitcoin has experienced multiple catastrophic declines exceeding 75%.
Since its most recent halving, Bitcoin has delivered extraordinary returns for those who survive the volatility, with impressive long-term performance despite extreme price swings.
The “digital gold” narrative:
- Many crypto participants view Bitcoin as digital gold, making it a dominant conceptual framework
- The U.S. SEC approved spot Bitcoin ETFs in January 2024
- However, behavioral evidence contradicts the safe-haven branding
Bitcoin exhibits near-zero or slightly positive correlation with the S&P 500 and behaves as a risk-on asset rather than a safe haven during crises. The World Gold Council’s analysis demonstrates this: adding gold to portfolios reduces volatility, while Bitcoin allocations increase portfolio risk.

Source: World Gold Council
What Volatility History Suggests About Gold’s Current Level
Gold’s current elevated price levels arrive with a volatility profile that suggests far less risk than the absolute price might imply. The underlying market structure differs from previous peaks that ended badly.
Why this rally is different:
- Central banks purchased over 1,000 tonnes annually for three consecutive years, representing sustained official sector buying
- These aren’t panic-driven flows but strategic allocation shifts
- The dollar’s share of global reserves has declined, indicating a genuine de-dollarization trend
For investors considering entry at current levels, the volatility comparison offers practical guidance:
Expected volatility ranges:
- Gold’s 15% annualized volatility implies that in ~68% of years, returns should fall between +15% and -15%
- A 28% drawdown (gold’s maximum observed) would be painful but historically recoverable
- By comparison, the S&P 500’s historical maximum drawdown of 57% represents catastrophic losses
- Bitcoin’s 75-80% corrections are simply in a different universe of risk
Recovery timeframes matter:
- Gold’s 2013 correction took roughly three years to fully recover
- The S&P 500’s financial crisis drawdown required 5-6 years
- The dot-com crash took over 7 years to recover
- Bitcoin bear markets have extended 2-3 years or more
Practical Guidance for Investors at Elevated Levels
The decision to buy gold at current prices demands clear assessment of what role the metal should play in portfolios.
Recommended allocations:
- Conservative investors: 5-10% of portfolio
- Aggressive growth portfolios: 2.5-5%
- Gold’s correlation with equities provides protection when it matters most
Investment approaches to consider:
- Dollar-cost averaging: Spreading purchases over 6-12 months captures average pricing and eliminates timing risk
- Realistic return expectations: From current levels, gold is unlikely to replicate past multi-decade returns, but can still provide 5-15% annually if structural drivers persist
- Choosing the right vehicle:
- Physical gold: Storage costs and 28% collectibles tax rate
- Gold ETFs: Liquidity and convenience with 0.25-0.40% annual fees
- Gold mining stocks: Operational leverage but company-specific risks
- Rebalancing discipline: Gold’s recent gains mean some investors now hold more than their target allocation, creating concentration risk
The psychological challenge:
Buying all-time highs feels uncomfortable, but gold’s historical pattern reveals that the metal has spent relatively little time at previous peaks before moving higher. Waiting for pullbacks has repeatedly cost investors significant gains during multi-year uptrends.
The Bitcoin comparison clarifies practical volatility tolerance. Bitcoin’s 54% annualized volatility translates to routine 20-30% monthly swings – unsuitable as a store of value for any funds needed within 3-5 years. Gold’s 15% volatility, matching stocks, means investors comfortable with equity portfolios should find gold’s movements tolerable.
The Bottom Line: A Maturing Asset in a Changing Monetary Order
Gold’s transformation from a speculative commodity into a strategic asset is nearly complete. Its volatility has converged with equities, yet its behavior in downturns remains inversely correlated, a unique duality few assets can replicate. Meanwhile, central-bank accumulation, declining dollar dominance, and persistent geopolitical uncertainty provide enduring structural tailwinds.
Corrections will come, 10–20% setbacks are natural, but the data suggests they’re not catastrophic. If current macro drivers persist, gold’s present valuation may not signal a bubble but rather a recalibration of fair value in a new global reserve framework.
In a world where equities can lose half their value overnight and crypto assets swing 20% in a day, gold’s quiet consistency may be its most underrated strength. It isn’t about chasing highs; it’s about understanding that stability itself has become the new scarcity.
This article belongs to Mooloo’s Asset Classes series, which examines how different assets behave over time and how they are used together to build resilient portfolios. View the full Asset Classes overview to see how each asset fits within a broader investment structure.